Why this matters
Build summary
Housing teams need clear views of demand and temporary accommodation pressure without mixing separate statutory stages.
I cleaned GOV.UK homelessness release metrics, separated duty-stage counts from temporary-accommodation counts and built trend and KPI views for policy-stage reporting.
Key numbers
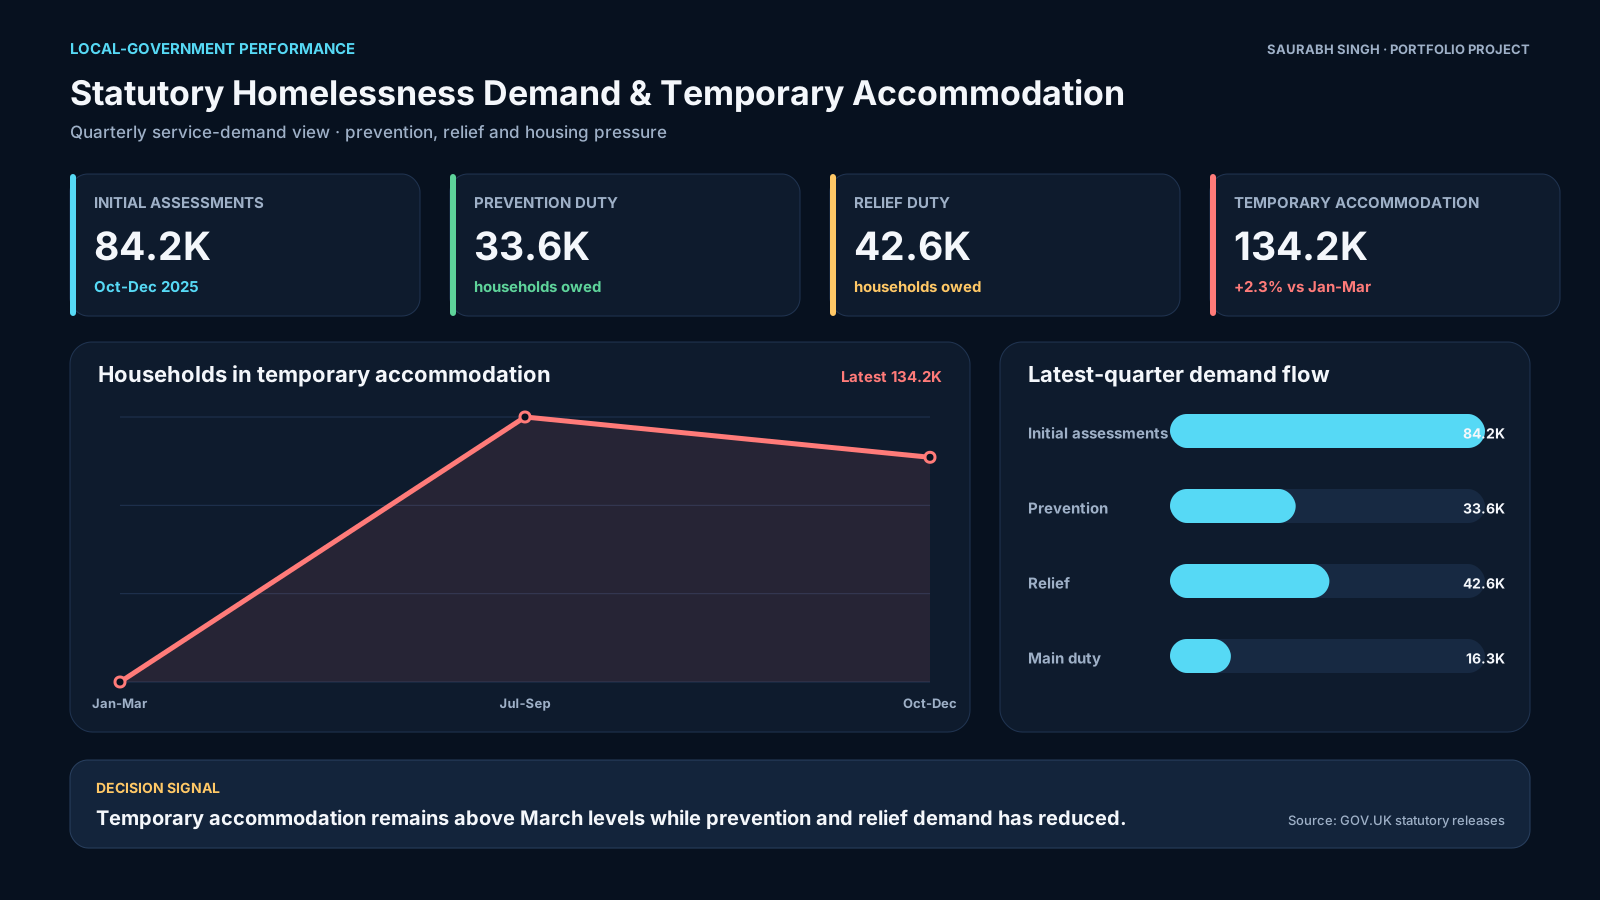
Oct-Dec 2025
latest quarter
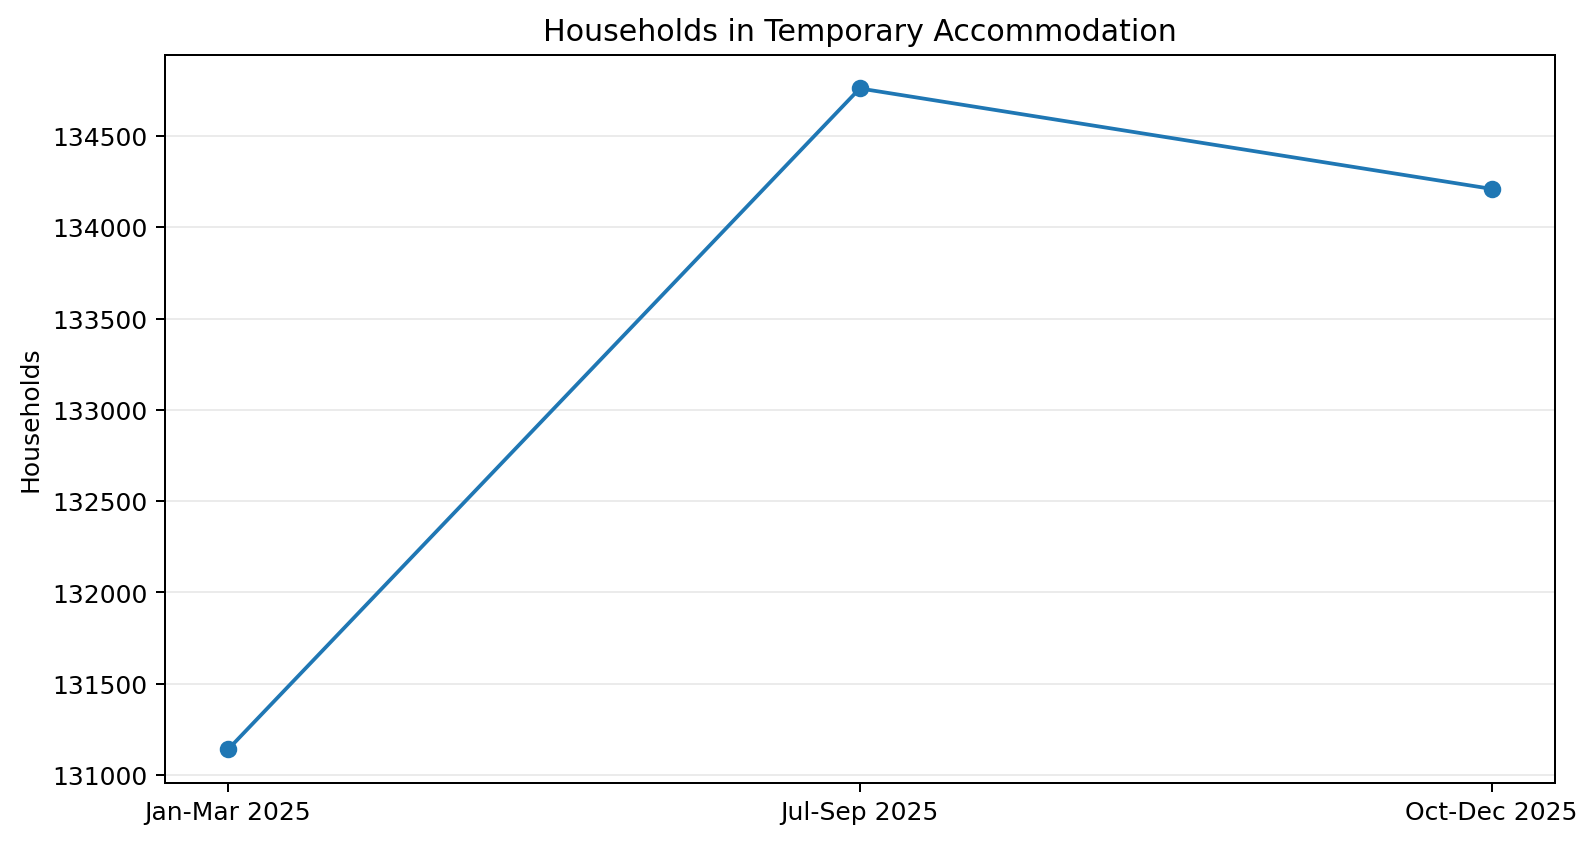
134,210
TA households
Public
GOV.UK data
What I wanted the report to help with
How I approached it
- Make the main performance question easier to scan.
- Separate headline totals from the detail that explains them.
- Show enough context for a non-technical user to trust the next action.
- Cleaned public release metrics.
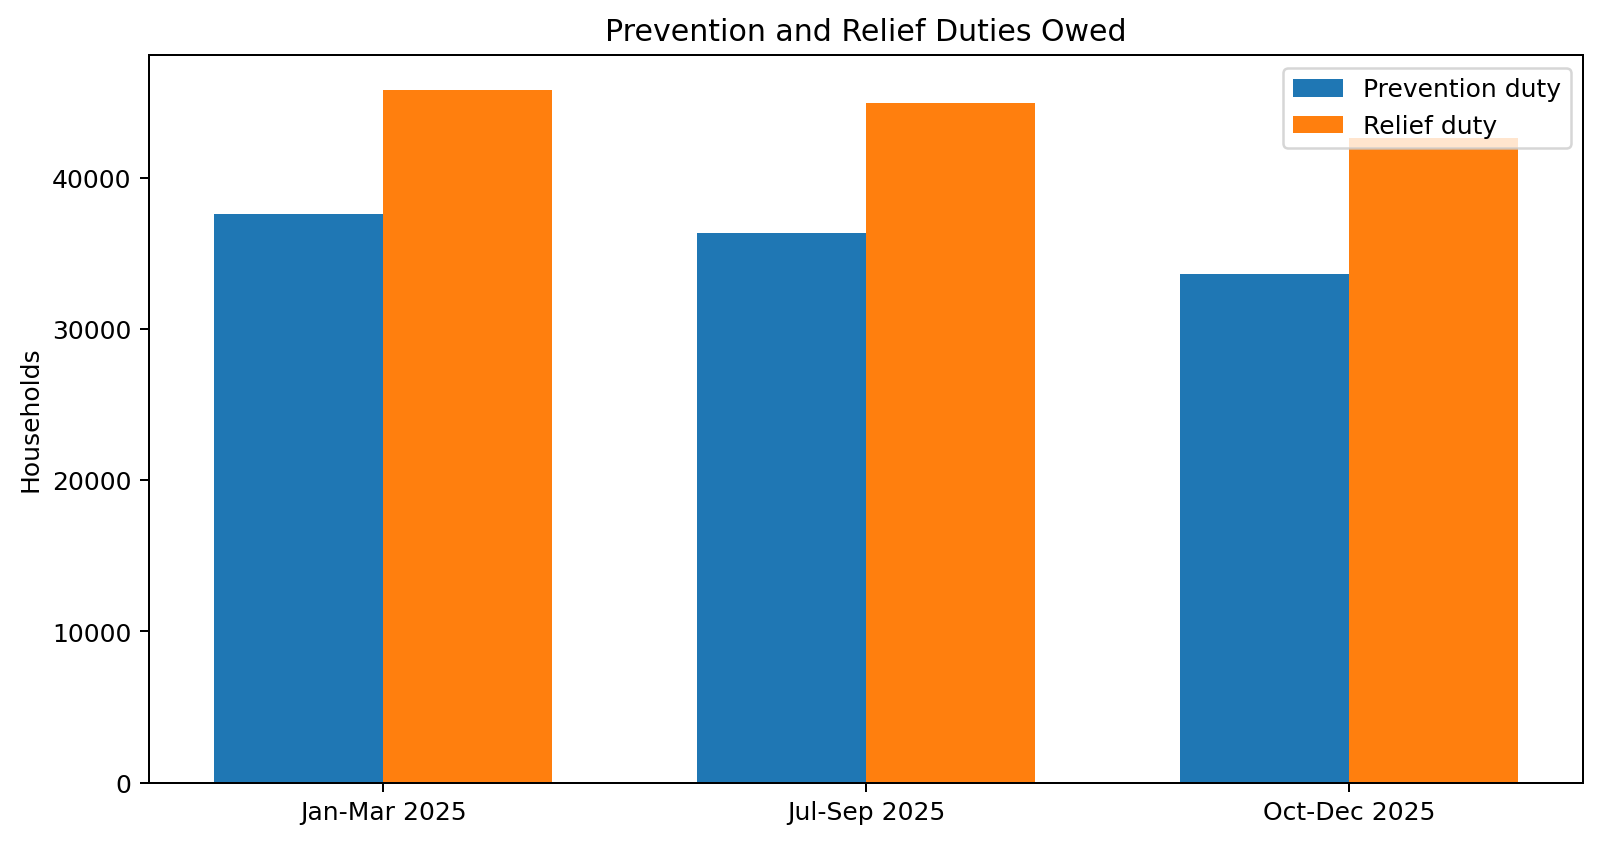
- Separated prevention, relief, main duty and temporary accommodation measures.
- Built a dashboard-style summary around latest quarter and trend movement.
Technical inspection notes
- Separated assessment, prevention, relief and temporary accommodation metrics because they describe different points in the statutory journey.
- Used public release data and labelled the source clearly so the report is honest about scope.
- Built trend views to show pressure over time rather than treating the release as a static table.
- Kept policy-stage definitions visible so a non-technical reader can follow the story.
Dashboard snapshots
These snapshots show how the analysis was turned into decision-ready visuals.
Click any screenshot to inspect the dashboard evidence more closely.
What the analysis showed
- Latest quarter analysed: Oct-Dec 2025.
- 134,210 households were in temporary accommodation at 31 December 2025.
- Temporary accommodation and duty stages need separate interpretation.
What I would improve next
- Add council-level benchmarking.
- Add year-on-year comparisons.
- Add notes for metric definitions.