Why this matters
Build summary
Commercial reporting needs to show movement and share, not only total sales.
I used Power Query and DAX to prepare category and manufacturer fields, then created sales, YTD sales, market-share and movement measures.
Key numbers
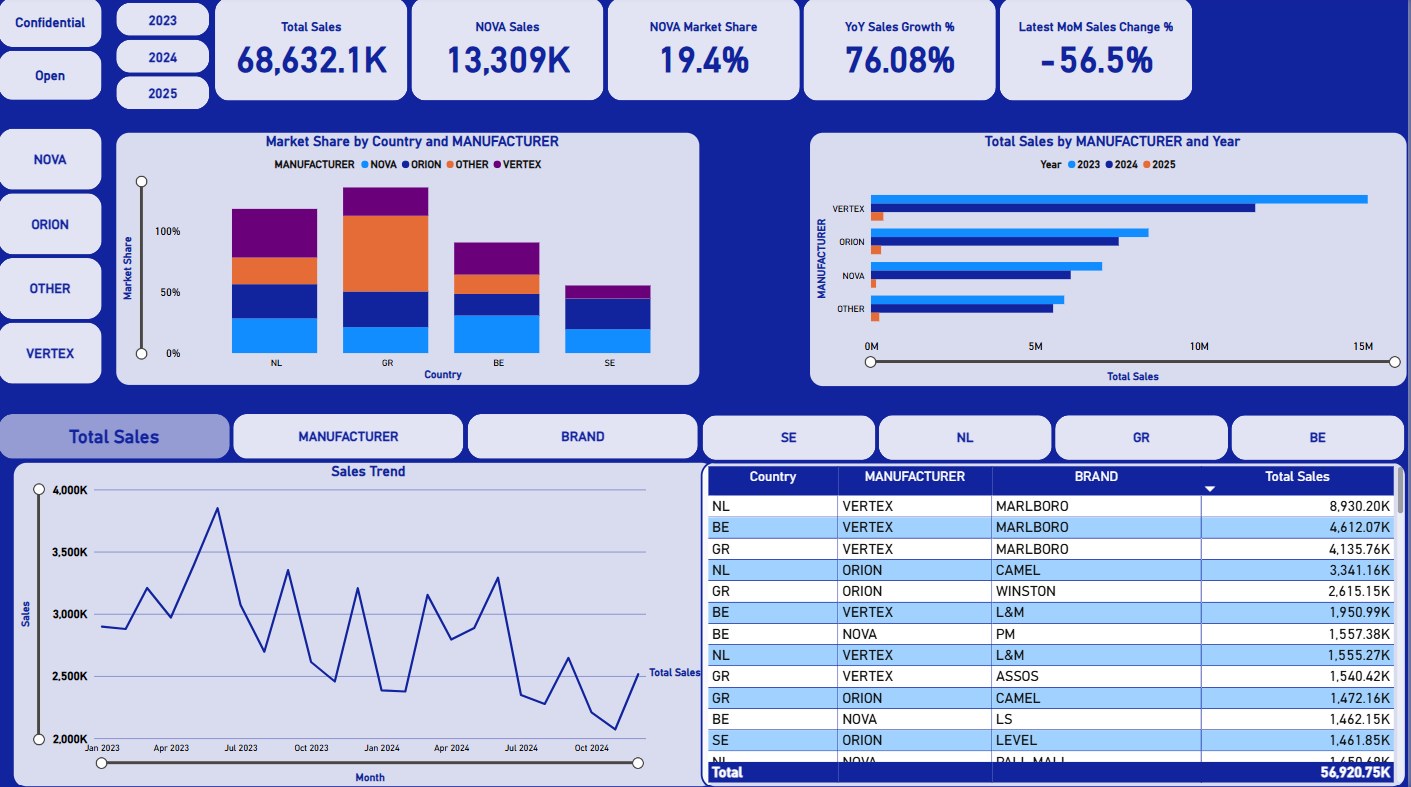
13,309K
NOVA sales
19.4%
market share
Power BI
dashboard
What I wanted the report to help with
How I approached it
- Make the main performance question easier to scan.
- Separate headline totals from the detail that explains them.
- Show enough context for a non-technical user to trust the next action.
- Cleaned manufacturer and category fields.
- Created sales, YTD and market-share measures.
- Built a comparison view for manufacturer performance.
Technical inspection notes
- Prepared category and manufacturer fields in Power Query before creating movement measures.
- Used DAX for sales, YTD sales, market share and change calculations.
- Focused the dashboard on what changed, where share moved and which manufacturer/category needed attention.
- Kept the analysis portfolio-labelled so the business logic is clear without overstating data ownership.
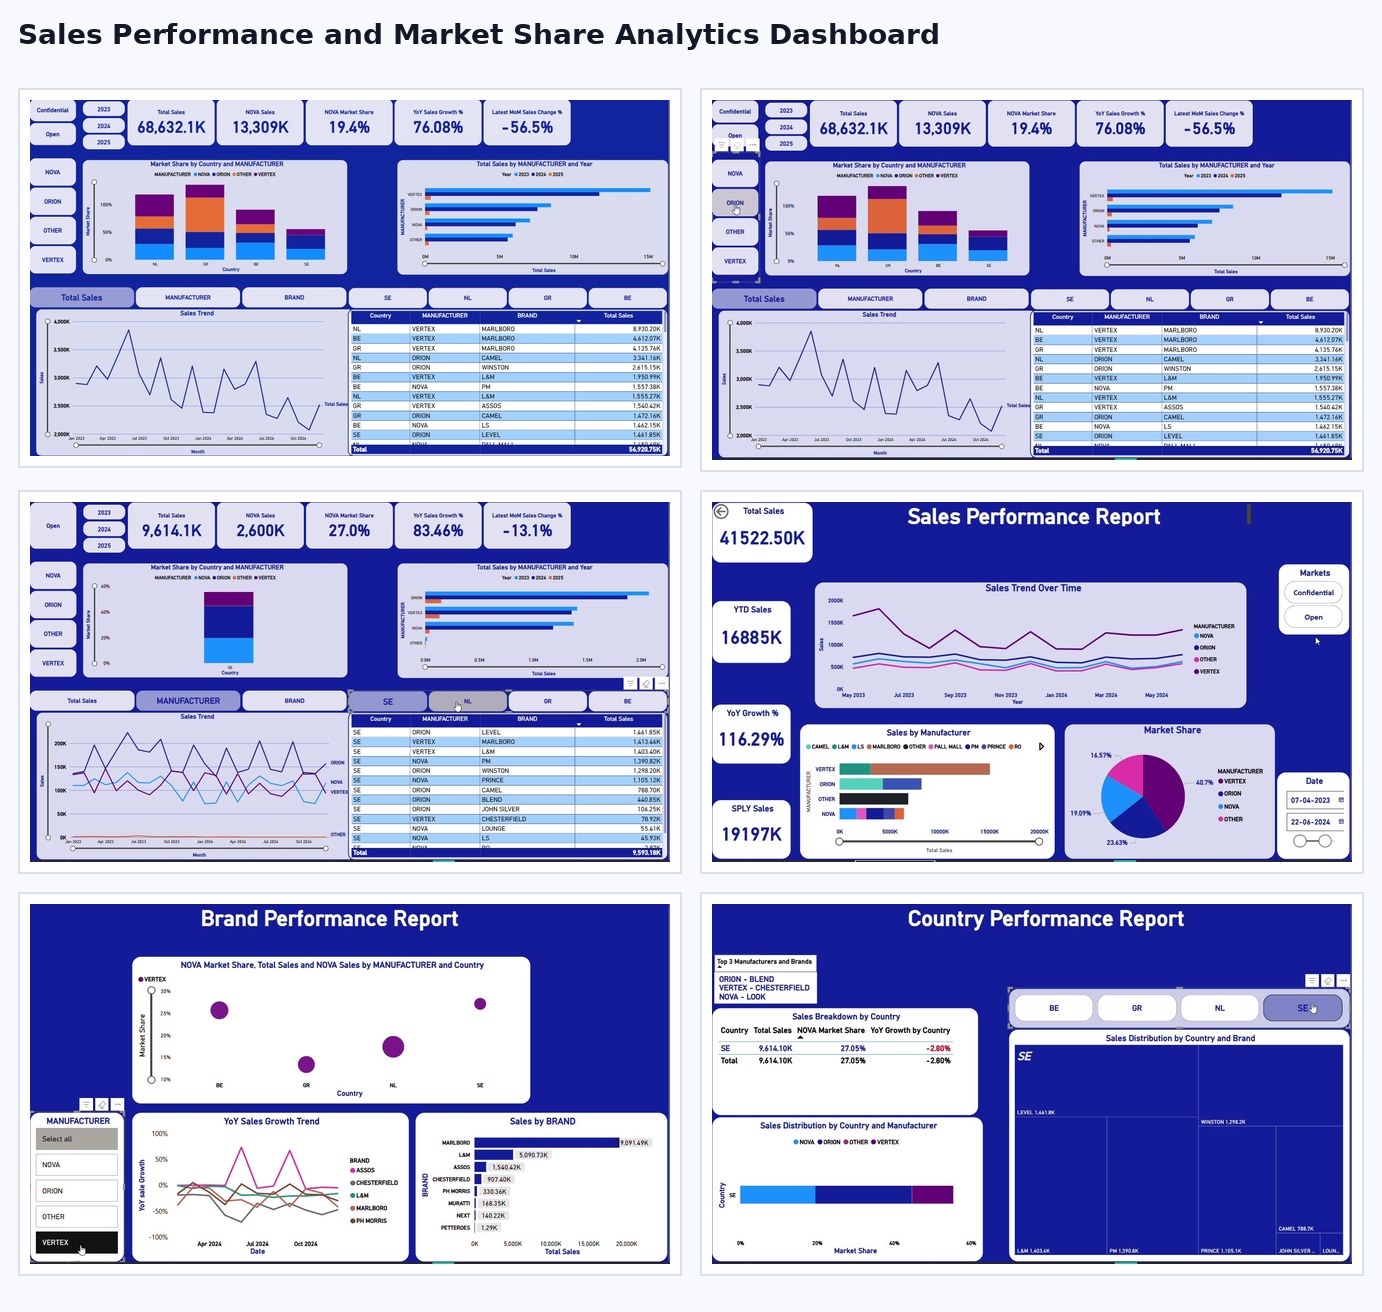
Dashboard snapshots
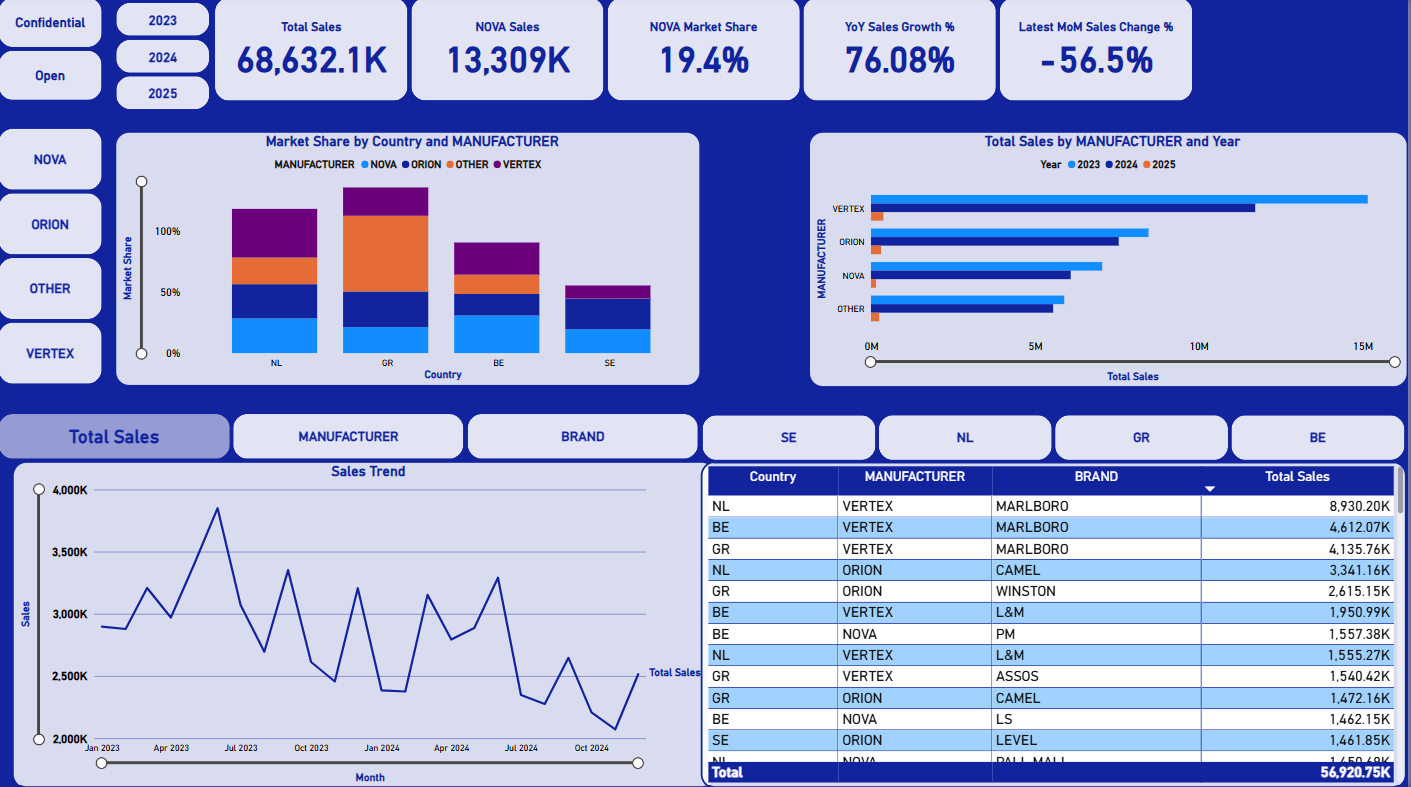
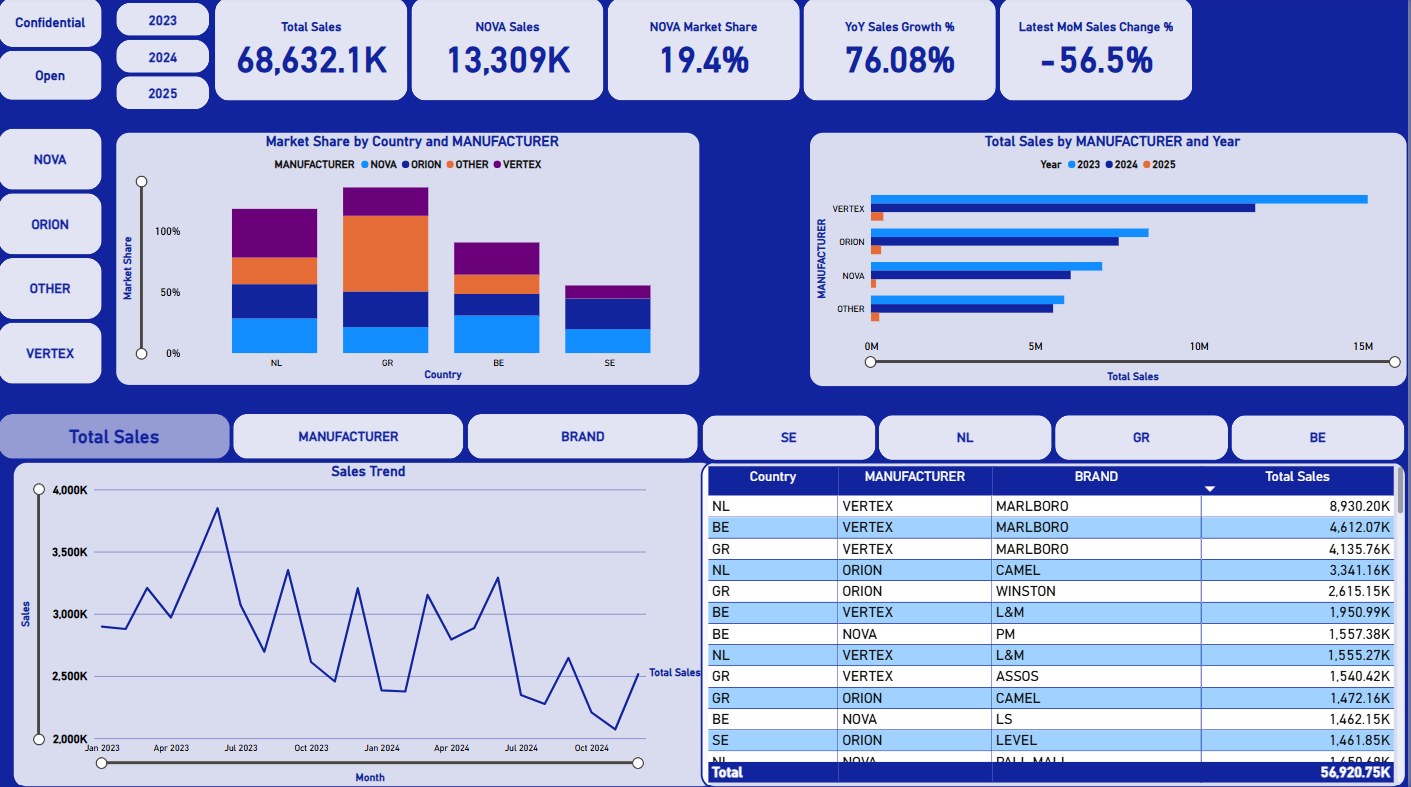
These snapshots show how the analysis was turned into decision-ready visuals.
Click any screenshot to inspect the dashboard evidence more closely.
What the analysis showed
- The selected view showed NOVA sales of 13,309K.
- Market share was 19.4%.
- Monthly movement helped show where attention was needed.
What I would improve next
- Add target and forecast comparison.
- Add product hierarchy drill-through.
- Add margin and promotion overlays.