Why this matters
Build summary
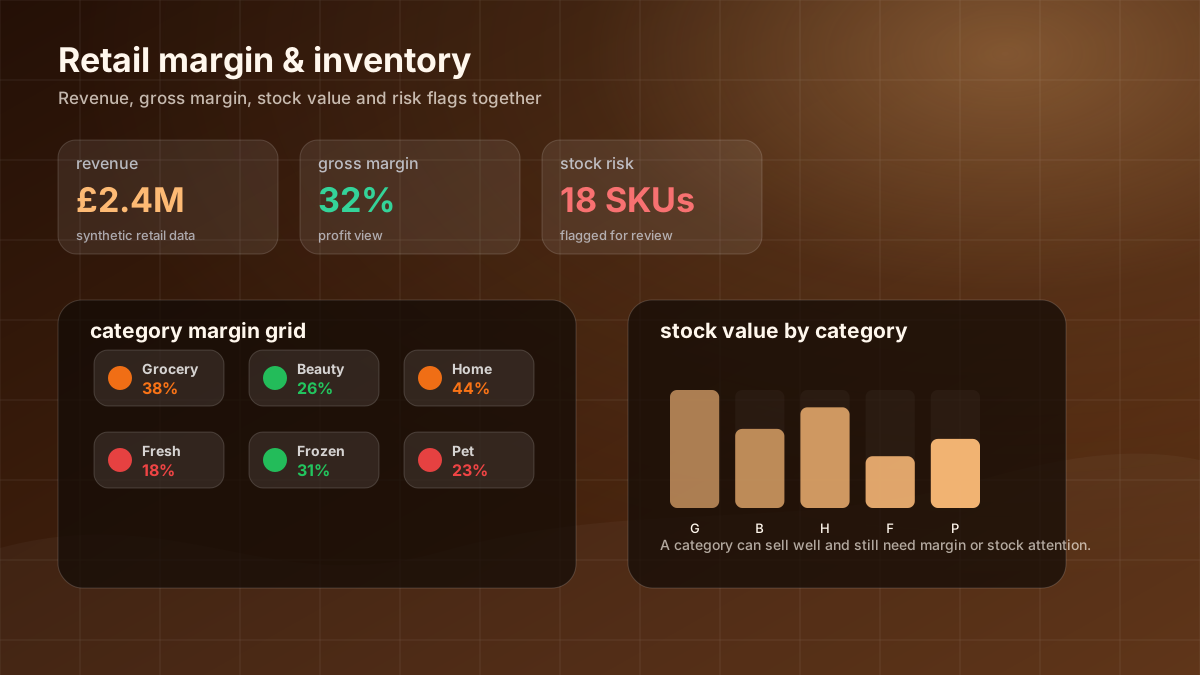
Retail teams need to see sales, margin and stock risk together. Revenue alone can hide where the business is overstocked, understocked or selling at weaker margin.
I used synthetic sales and inventory data to calculate revenue, gross profit, margin, stock value and risk flags. I compared categories by both profit and margin, then separated stock-out and excess-stock risk.
Key numbers
£7.22M
revenue
37.5%
gross margin
297
stock-out risk items
What I wanted the report to help with
How I approached it
- Make the main performance question easier to scan.
- Separate headline totals from the detail that explains them.
- Show enough context for a non-technical user to trust the next action.
- Built revenue, gross profit and margin calculations.
- Created category and store summaries.
- Flagged stock-out and excess-stock risks separately.
Technical inspection notes
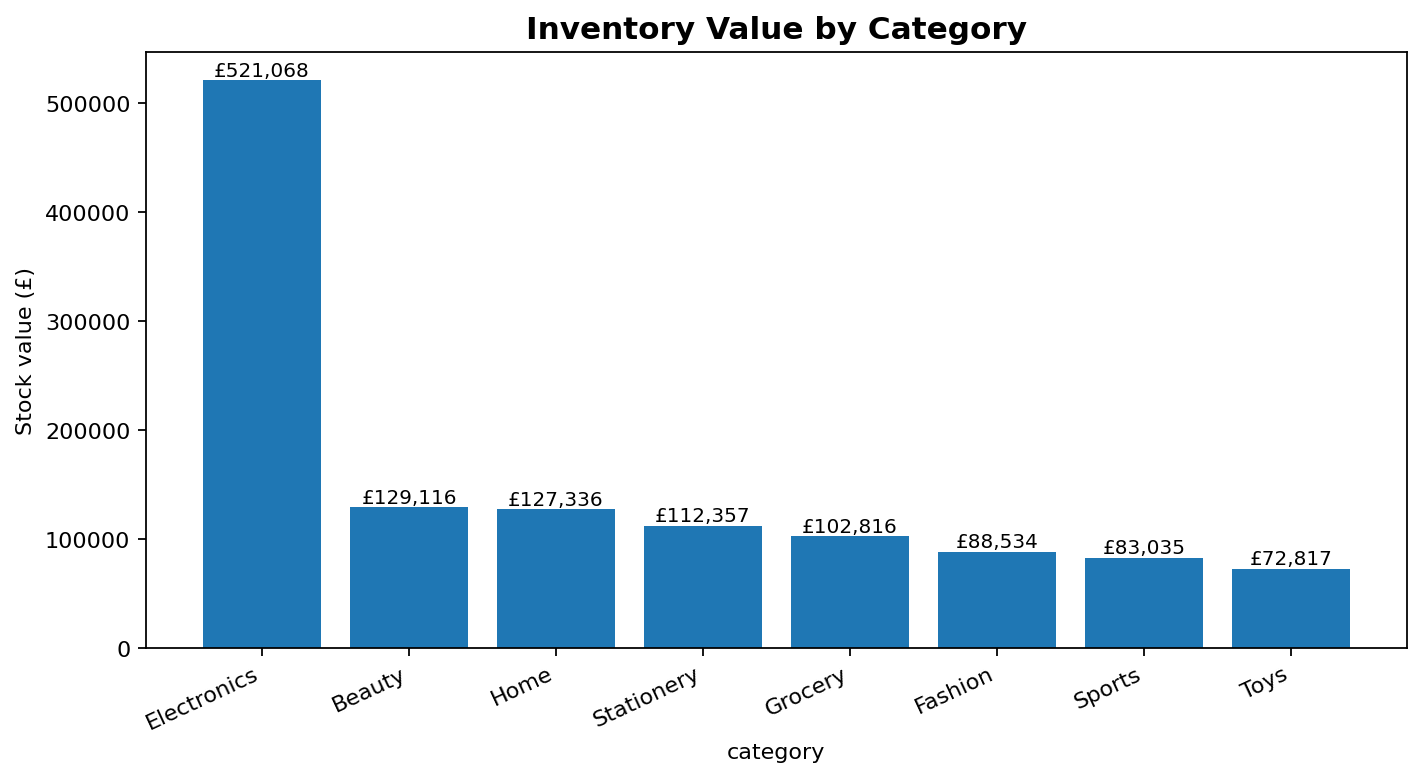
- Separated revenue, gross profit, margin and stock value so strong sales do not hide poor profitability or availability risk.
- Created stock-risk flags to identify both low-stock and excess-stock pressure.
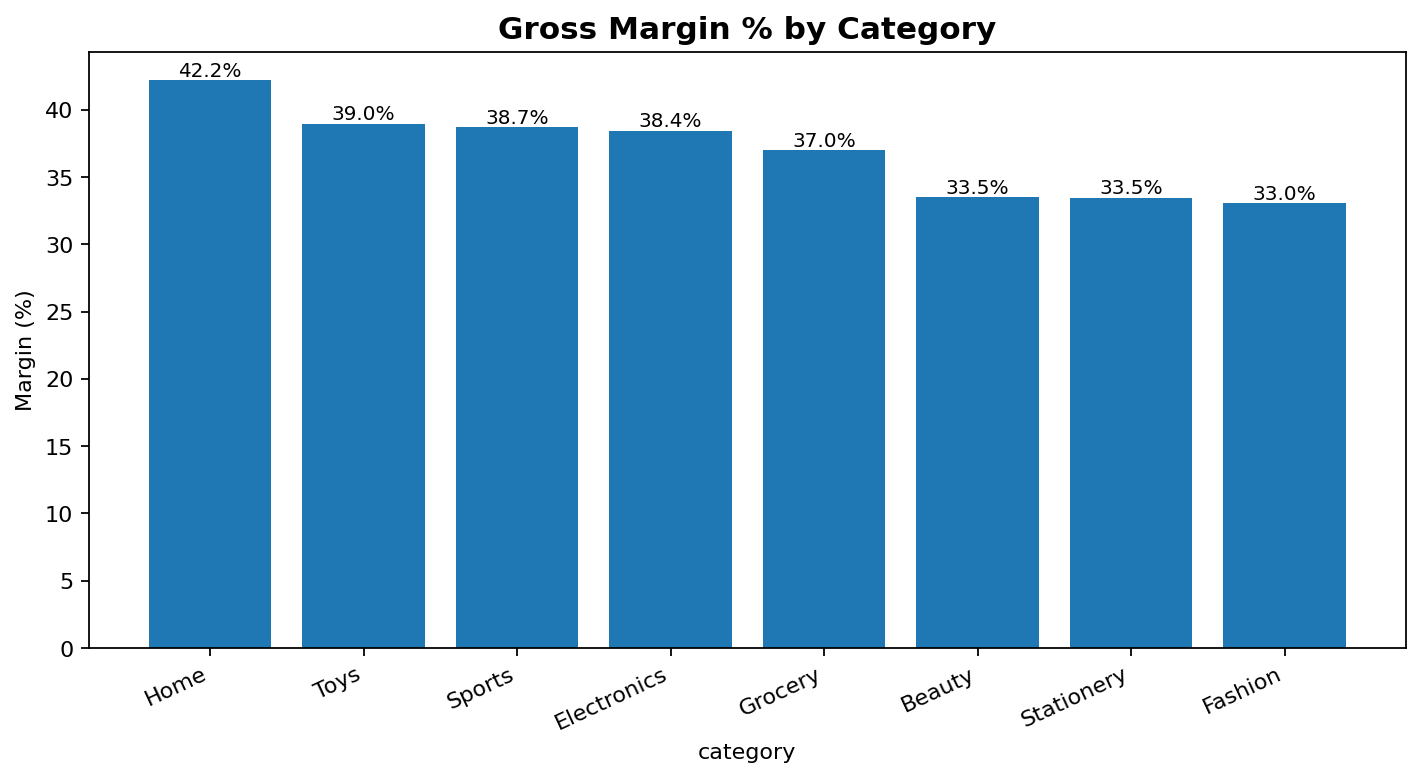
- Compared categories by margin and profit because each tells a different business story.
- Kept the dataset labelled as synthetic so the method is clear without pretending it is live company data.
Dashboard snapshots
These snapshots show how the analysis was turned into decision-ready visuals.
Click any screenshot to inspect the dashboard evidence more closely.
What the analysis showed
- The sample dataset showed £7.22M revenue.
- Gross margin was 37.5%.
- 297 items were flagged as stock-out risk.
What I would improve next
- Add supplier lead time.
- Add markdown and promotion effects.
- Create action owners for high-risk stock groups.