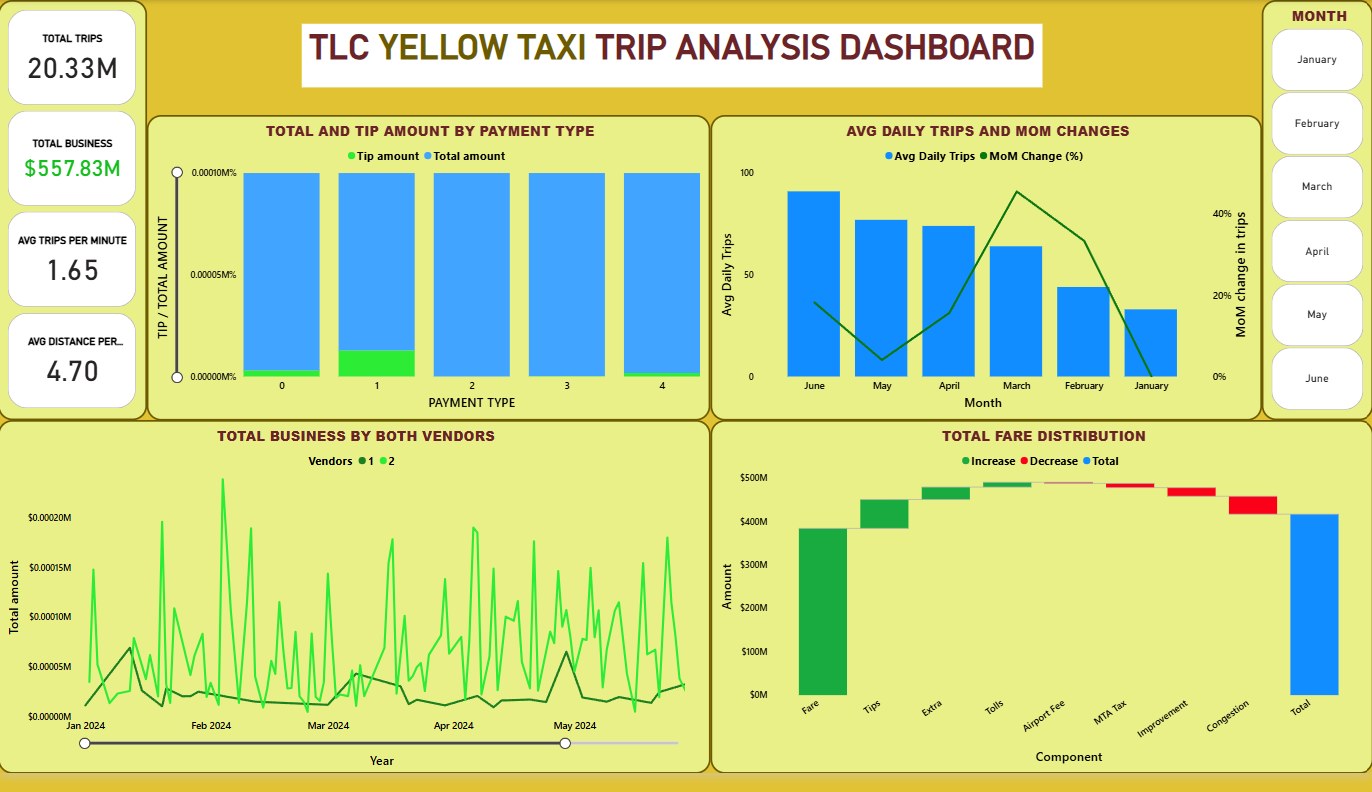
Why this matters
Build summary
This project shows the full journey from raw operational records to a reporting-ready dataset and dashboard.
I used public NYC TLC data, built a cloud pipeline with Mage AI and BigQuery, transformed raw trip records and created a reporting layer for operational analysis.
Key numbers
Public
NYC TLC data
BigQuery
warehouse
Mage AI
pipeline
What I wanted the report to help with
How I approached it
- Make the main performance question easier to scan.
- Separate headline totals from the detail that explains them.
- Show enough context for a non-technical user to trust the next action.
- Used public NYC TLC taxi trip data.
- Built a cloud-style pipeline using Mage AI and BigQuery.
- Prepared summary tables for trip volume, revenue, vendor and payment analysis.
Technical inspection notes
- Used public NYC TLC trip data as a pipeline-style project rather than only a dashboard exercise.
- Structured the flow from raw trips to warehouse tables to a reporting layer.
- Used BigQuery-style thinking to separate storage, transformation and analysis concerns.
- Focused the report on trips, revenue, vendors and payment behaviour so the output stayed operational.
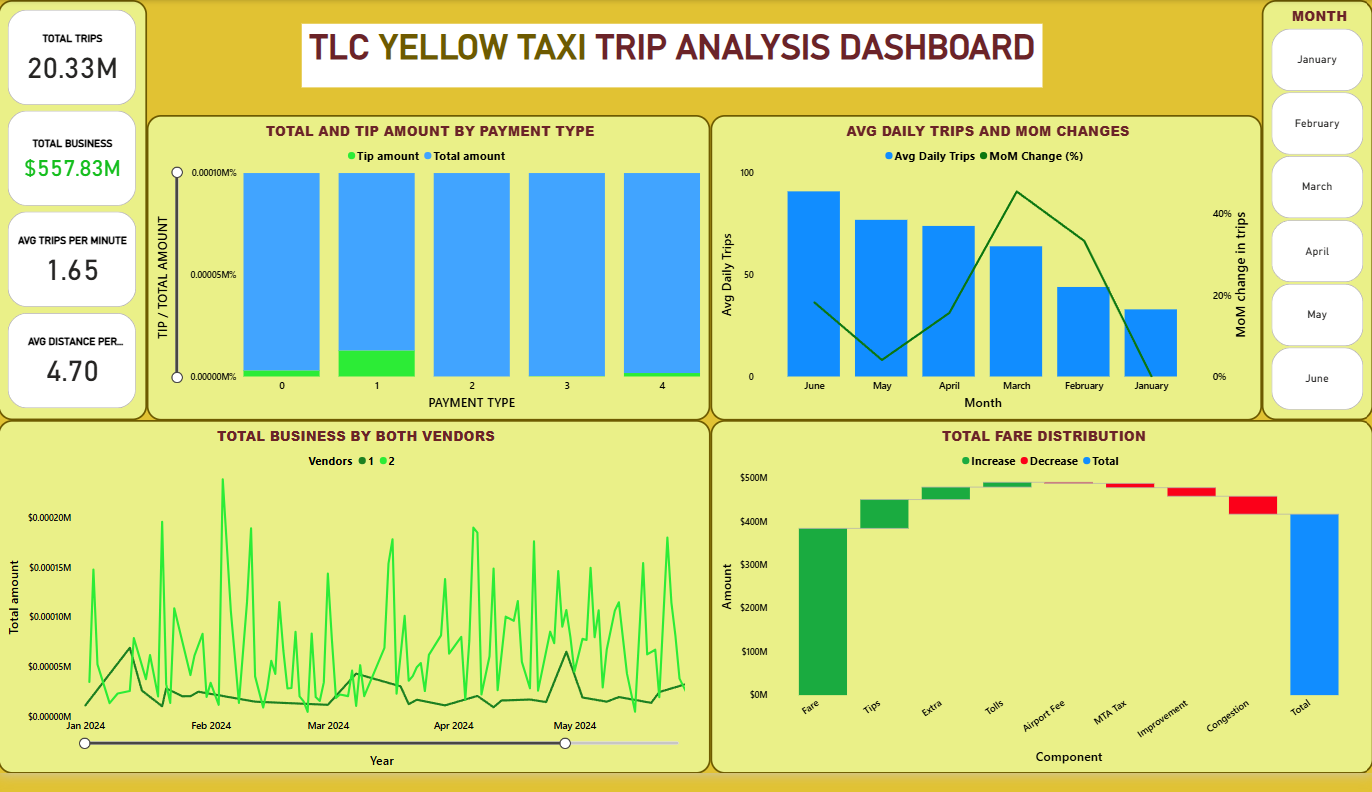
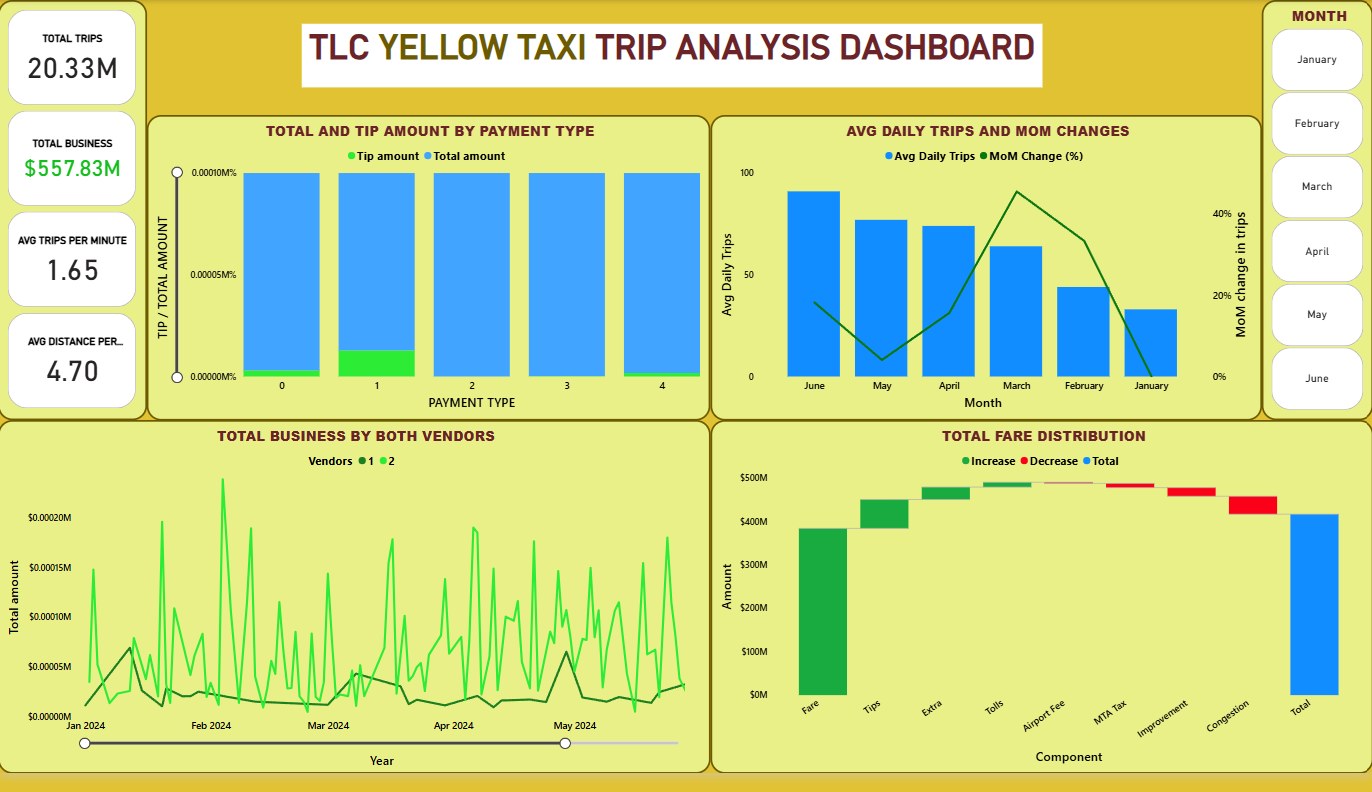
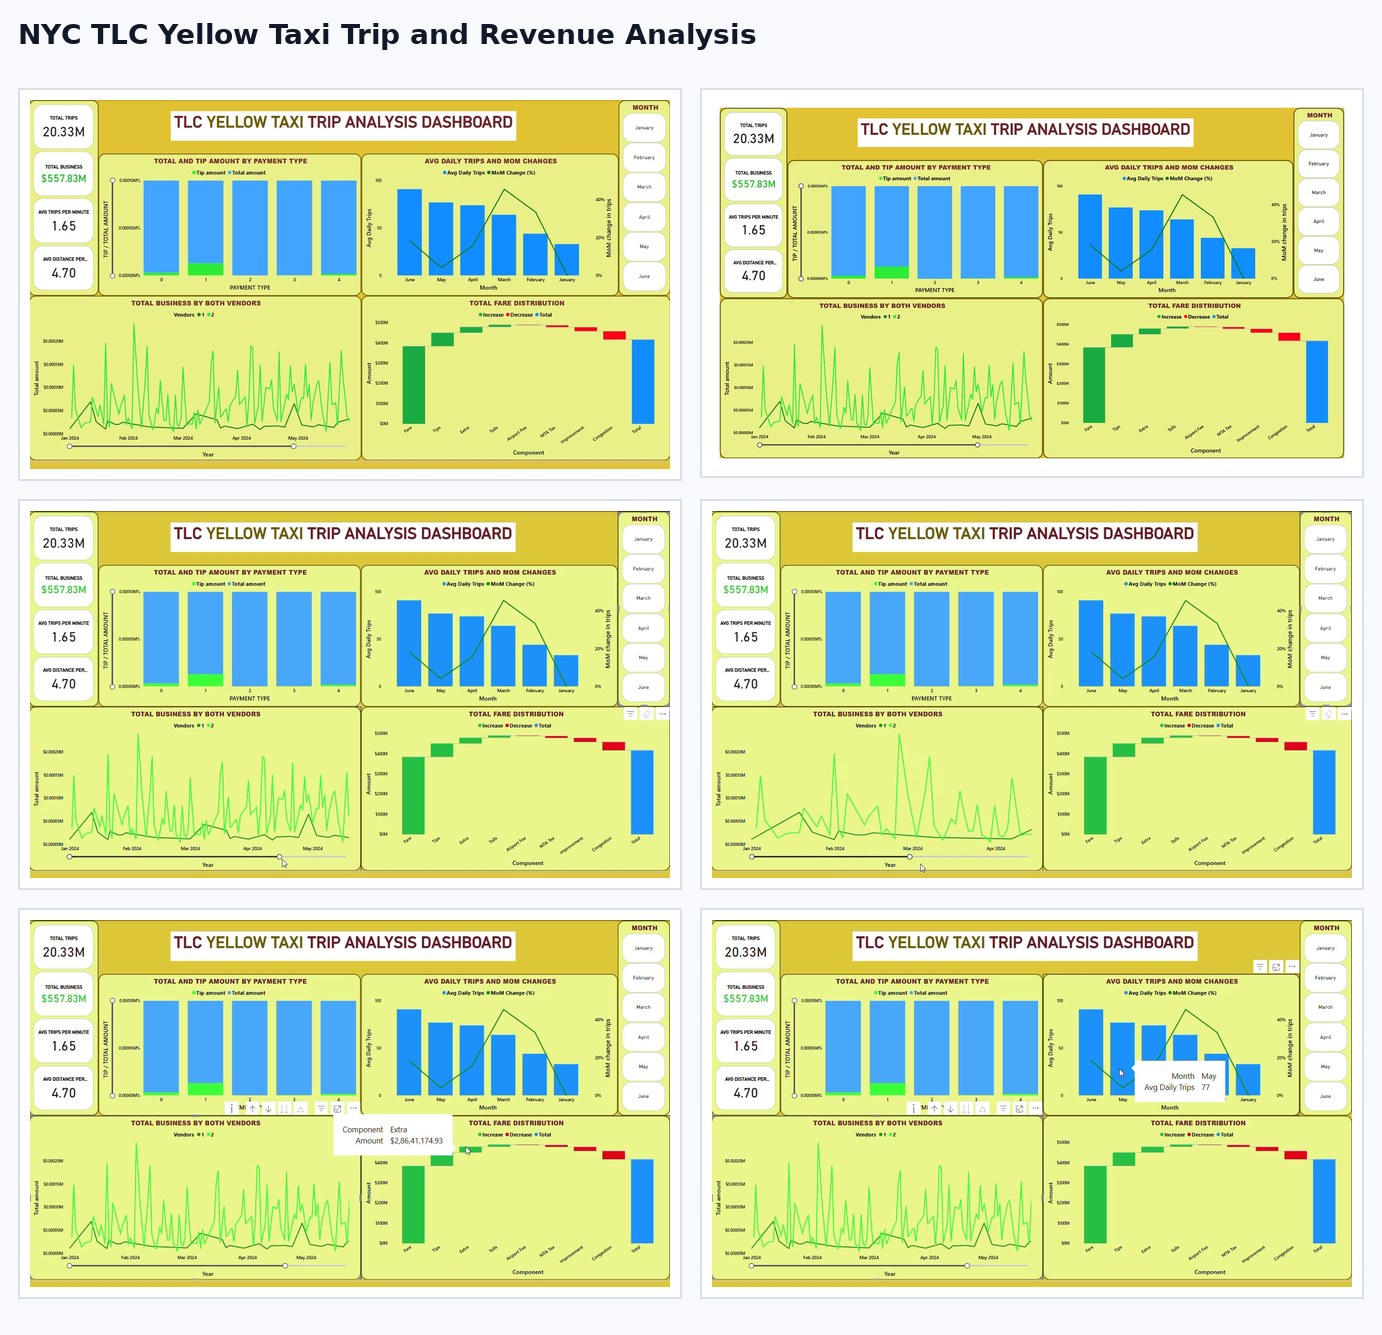
Dashboard snapshots
These snapshots show how the analysis was turned into decision-ready visuals.
Click any screenshot to inspect the dashboard evidence more closely.
What the analysis showed
- The dashboard focused on trip volume and revenue.
- Payment and vendor behaviour were separated into comparable views.
- The build demonstrates pipeline thinking, not only dashboarding.
What I would improve next
- Add scheduled refresh.
- Add data-quality checks at ingestion.
- Add partitioning and cost-control notes for BigQuery.