Why this matters
Build summary
A smaller business still needs clear reporting on where revenue comes from and which customers or products contribute most.
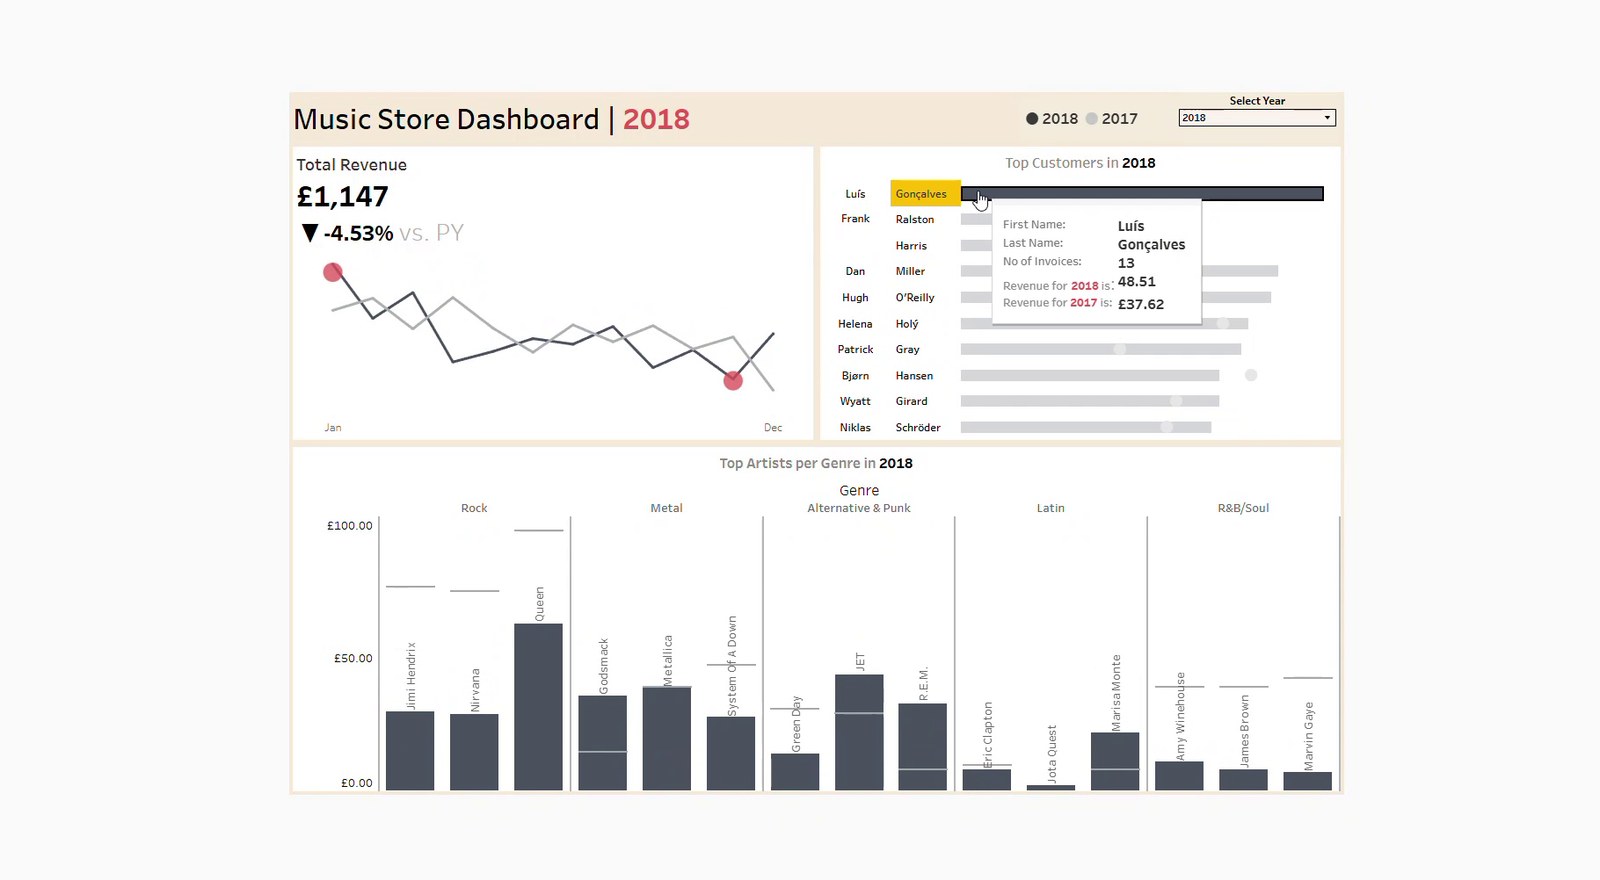
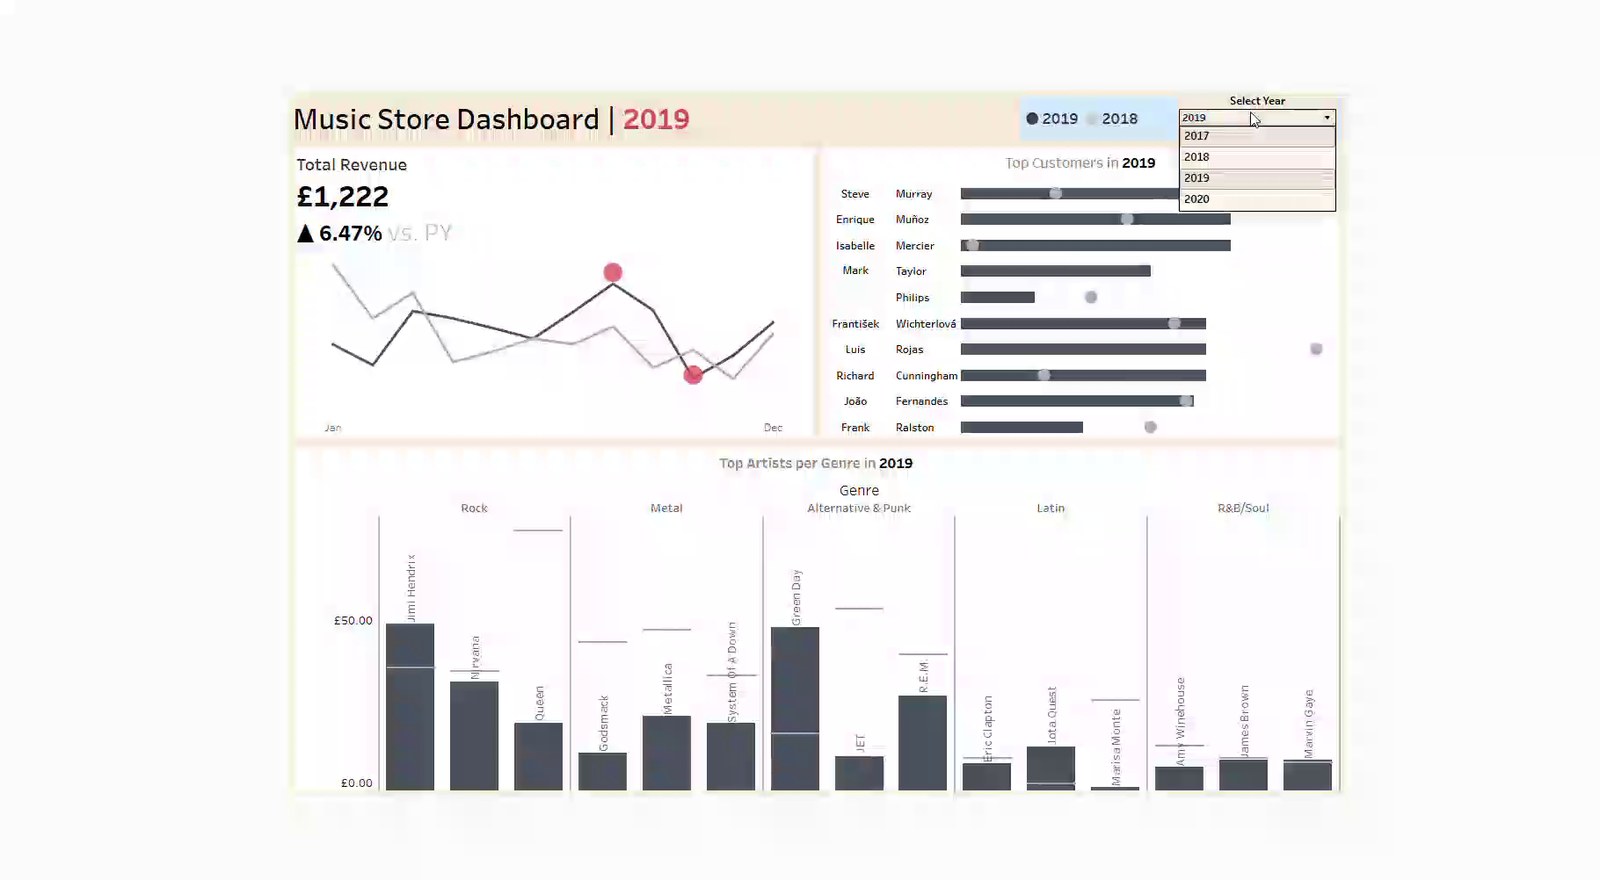
I used transaction-level music-store data to create revenue trends, customer ranking and contribution views, keeping the model simple and decision-focused.
Key numbers
Revenue
trend view
Customers
ranking
SQL
analysis
What I wanted the report to help with
How I approached it
- Make the main performance question easier to scan.
- Separate headline totals from the detail that explains them.
- Show enough context for a non-technical user to trust the next action.
- Used transaction-level sales data.
- Prepared customer and product contribution views.
- Built a simple dashboard around revenue movement.
Technical inspection notes
- Used transaction-level records to build revenue, customer and genre contribution views.
- Kept the model deliberately simple because the project is about clean business reporting, not complexity.
- Separated customer ranking from product contribution so the dashboard answers different business questions.
- Used SQL-style thinking around joins and transaction grain before designing the visual layer.
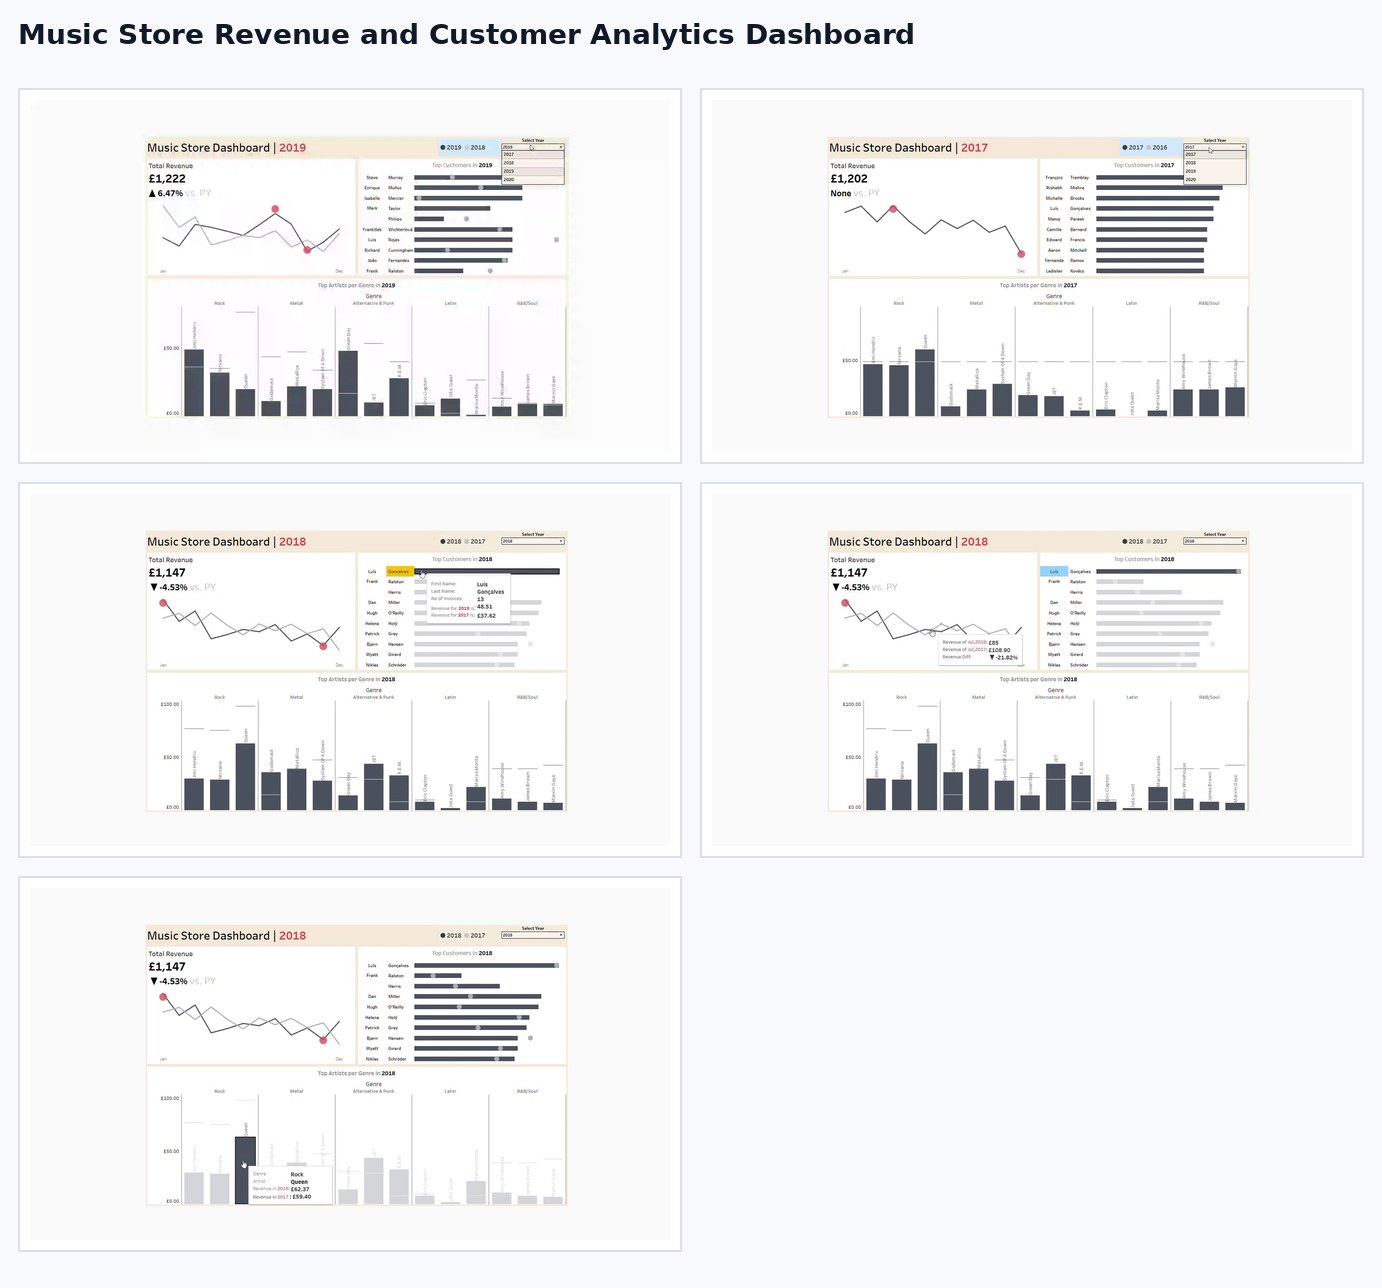
Dashboard snapshots
These snapshots show how the analysis was turned into decision-ready visuals.
Click any screenshot to inspect the dashboard evidence more closely.
What the analysis showed
- The report tracked revenue movement.
- Top customers were ranked by value.
- Genre and artist contribution helped explain the mix.
What I would improve next
- Add repeat-purchase cohorts.
- Add customer lifetime value.
- Add margin if cost data becomes available.