Why this matters
Build summary
A campaign can look successful by response rate while still underperforming after cost. I built this to focus on incremental profit and decision quality.
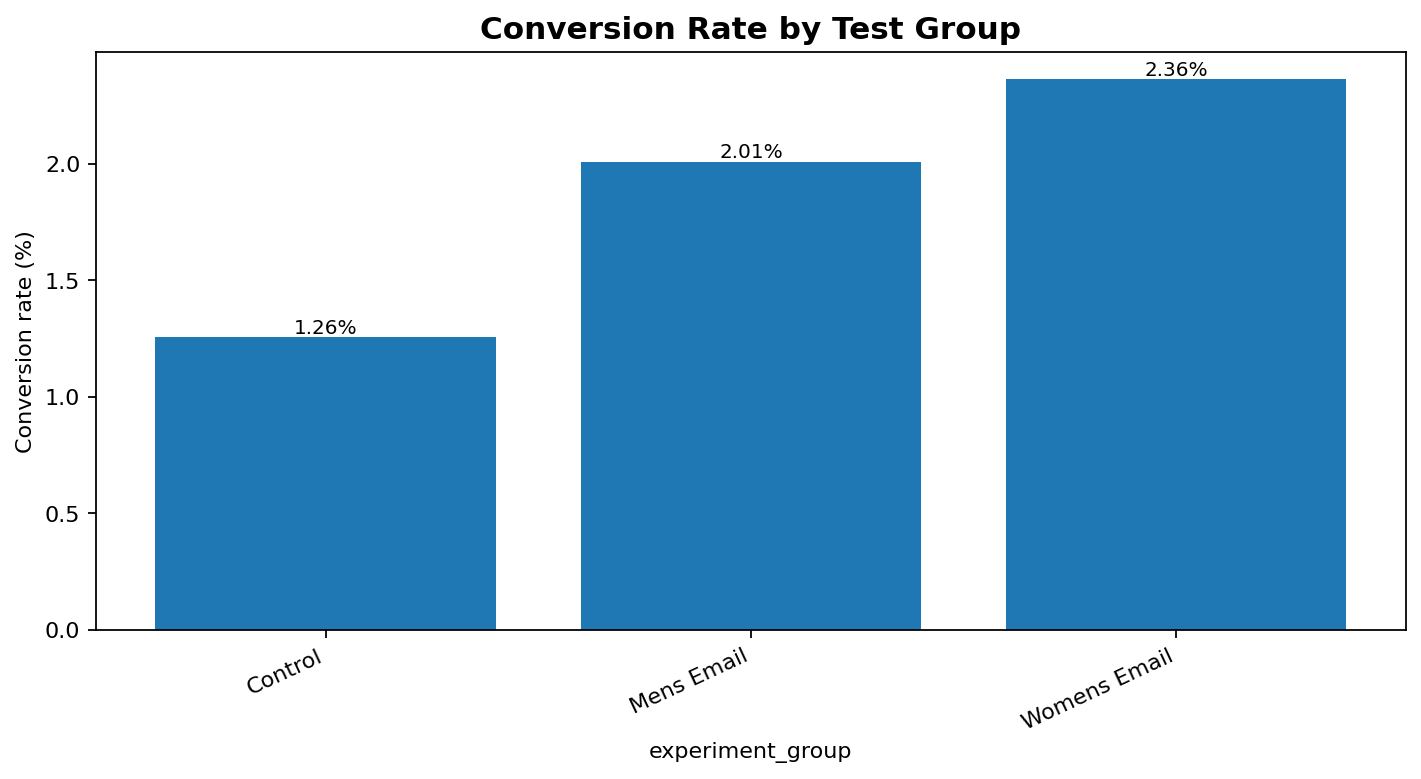
I compared control and treatment groups using conversion rate, revenue per customer, incremental margin, campaign cost and ROI. I would improve the next version with confidence intervals and segment-level testing.
Key numbers
1.1%
conversion lift
£4,298
incremental profit
2 groups
tested against control
What I wanted the report to help with
How I approached it
- Make the main performance question easier to scan.
- Separate headline totals from the detail that explains them.
- Show enough context for a non-technical user to trust the next action.
- Created treatment vs control group summaries.
- Calculated conversion lift, revenue per customer and incremental profit.
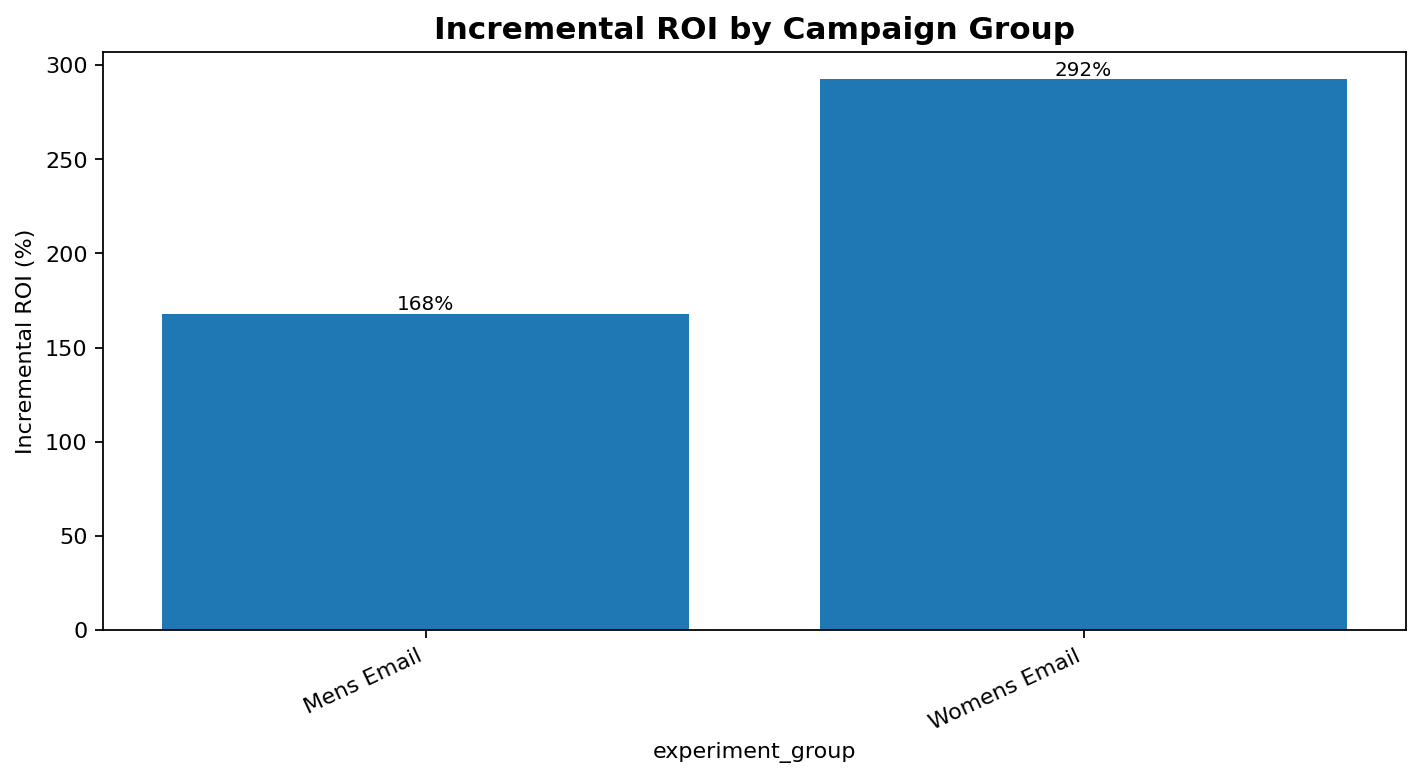
- Compared ROI after campaign cost rather than using conversion rate alone.
Technical inspection notes
- Compared control and treatment groups using conversion, revenue per customer and campaign cost, not conversion alone.
- Calculated incremental profit after cost so the test answered a commercial question rather than a vanity-metric question.
- Kept segment-level results visible because uplift can look strong overall and still behave differently across customer groups.
- Next improvement would be confidence intervals and clearer sample-size checks before recommending rollout.
Dashboard snapshots
These snapshots show how the analysis was turned into decision-ready visuals.
Click any screenshot to inspect the dashboard evidence more closely.
What the analysis showed
- The women's email was the stronger treatment.
- It produced 1.1% conversion lift.
- It produced £4,298 incremental profit after campaign cost.
What I would improve next
- Add confidence intervals.
- Compare results by customer segment.
- Add holdout-period analysis before recommending rollout.