Why this matters
Build summary
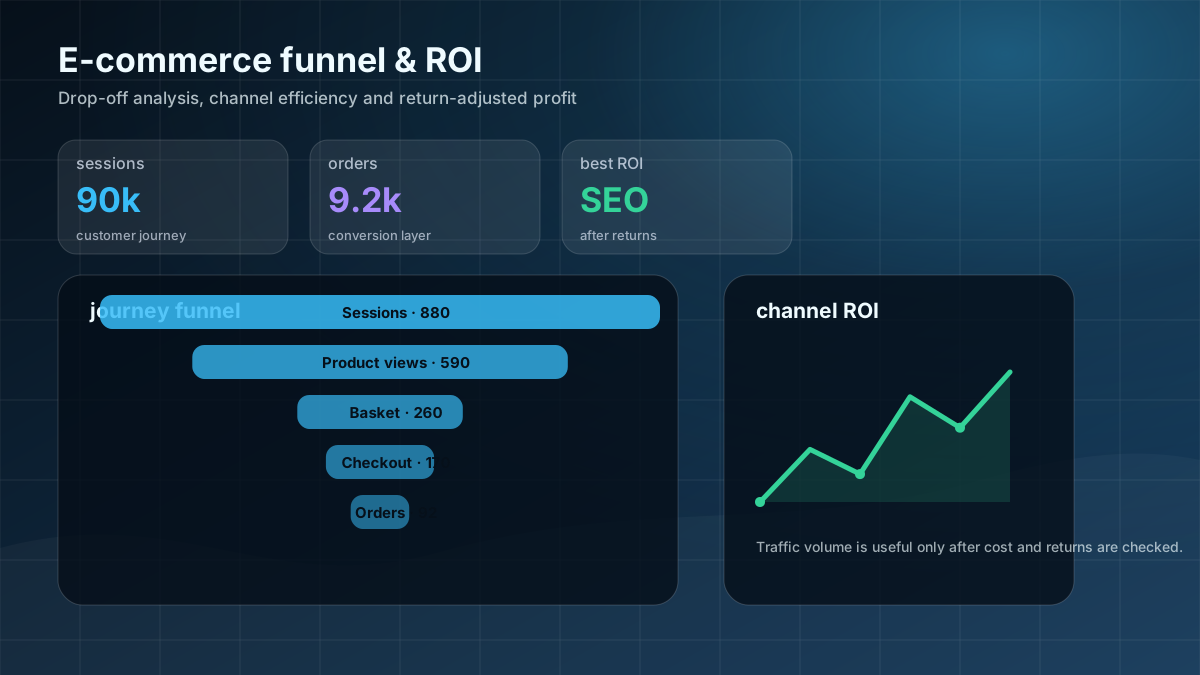
Marketing traffic only matters if it converts profitably. This project looks beyond visits and asks which channels actually pay back.
I analysed 90,000 synthetic sessions using session-to-order conversion, revenue per session, return effect, channel spend and gross profit after marketing. Python summaries were shaped into Power BI-ready outputs.
Key numbers
90,000
sessions
4.9%
order conversion
£262,561
net revenue
What I wanted the report to help with
How I approached it
- Make the main performance question easier to scan.
- Separate headline totals from the detail that explains them.
- Show enough context for a non-technical user to trust the next action.
- Created session, basket and order-stage summaries.
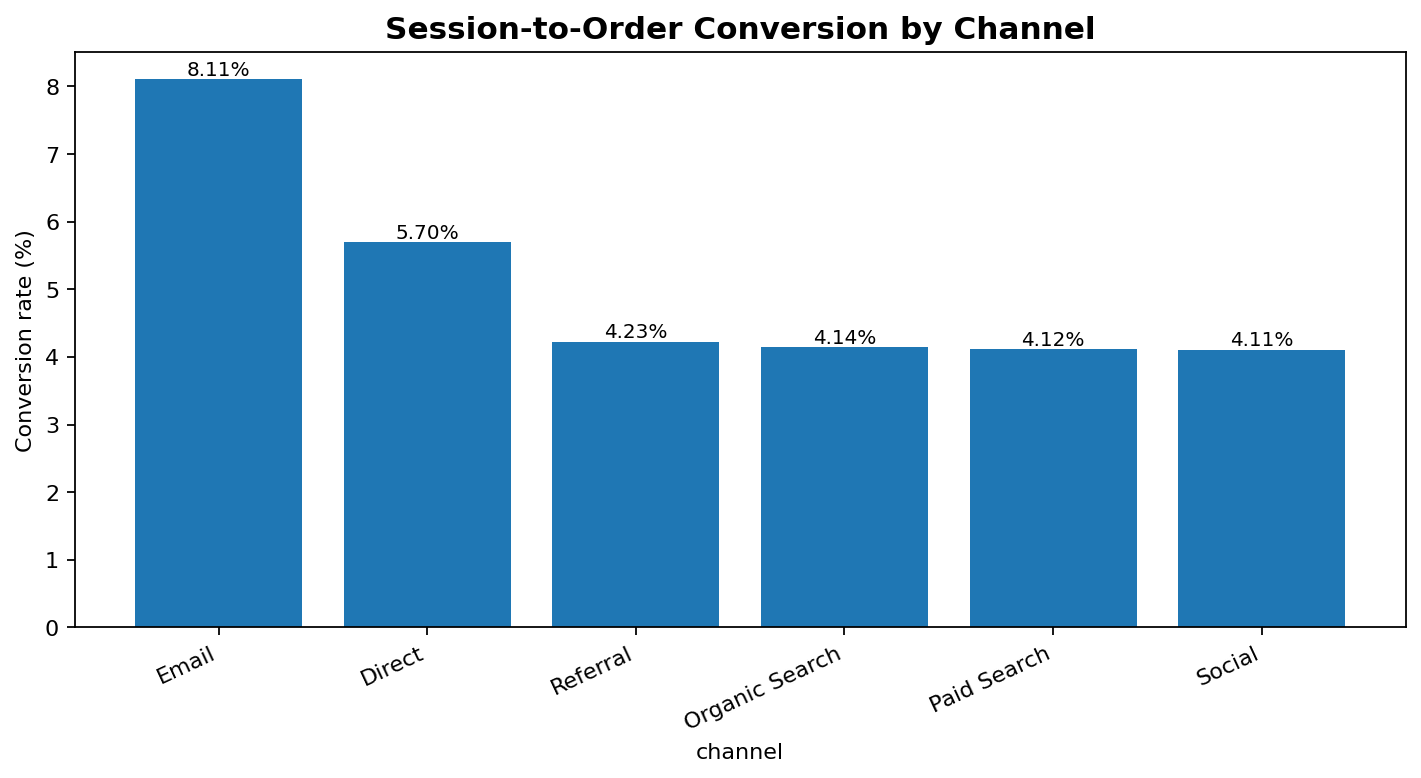
- Calculated channel-level conversion and revenue per session.
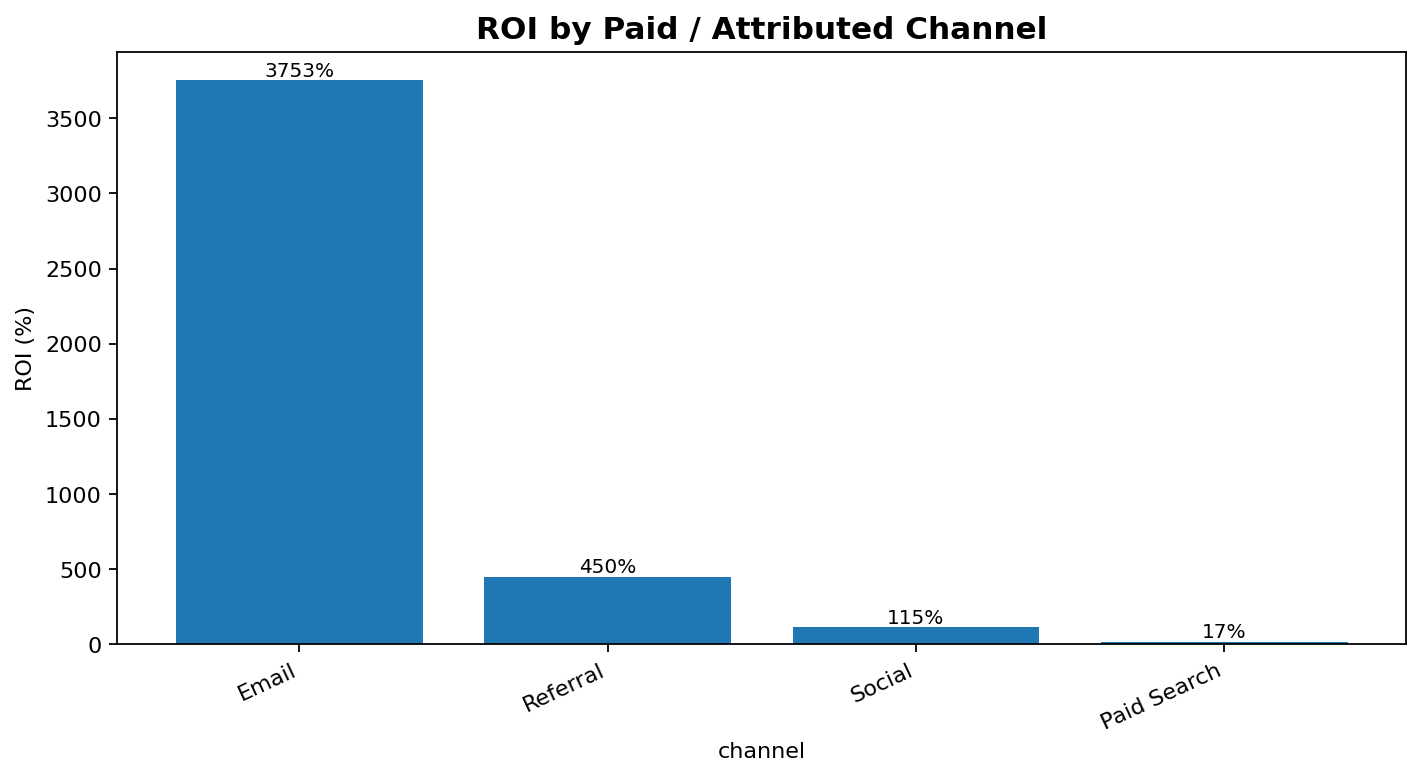
- Included returns and marketing spend in ROI logic.
Technical inspection notes
- Modelled the funnel from session to order so drop-off could be reviewed by channel.
- Calculated revenue per session and profit after marketing to avoid overvaluing high-traffic channels.
- Included returns in the commercial view because channel quality can change after refund behaviour is included.
- Used Python summaries shaped into Power BI-ready outputs for cleaner dashboard logic.
Dashboard snapshots
These snapshots show how the analysis was turned into decision-ready visuals.
Click any screenshot to inspect the dashboard evidence more closely.
What the analysis showed
- The synthetic dataset included 90,000 sessions.
- Order conversion was 4.9%.
- Net revenue was £262,561.
What I would improve next
- Add attribution windows.
- Add device and product-category cuts.
- Add confidence intervals around channel differences.