Why this matters
Build summary
Patient-review text is messy, inconsistent and subjective. This project explores how NLP can summarise patterns while being careful about limitations.
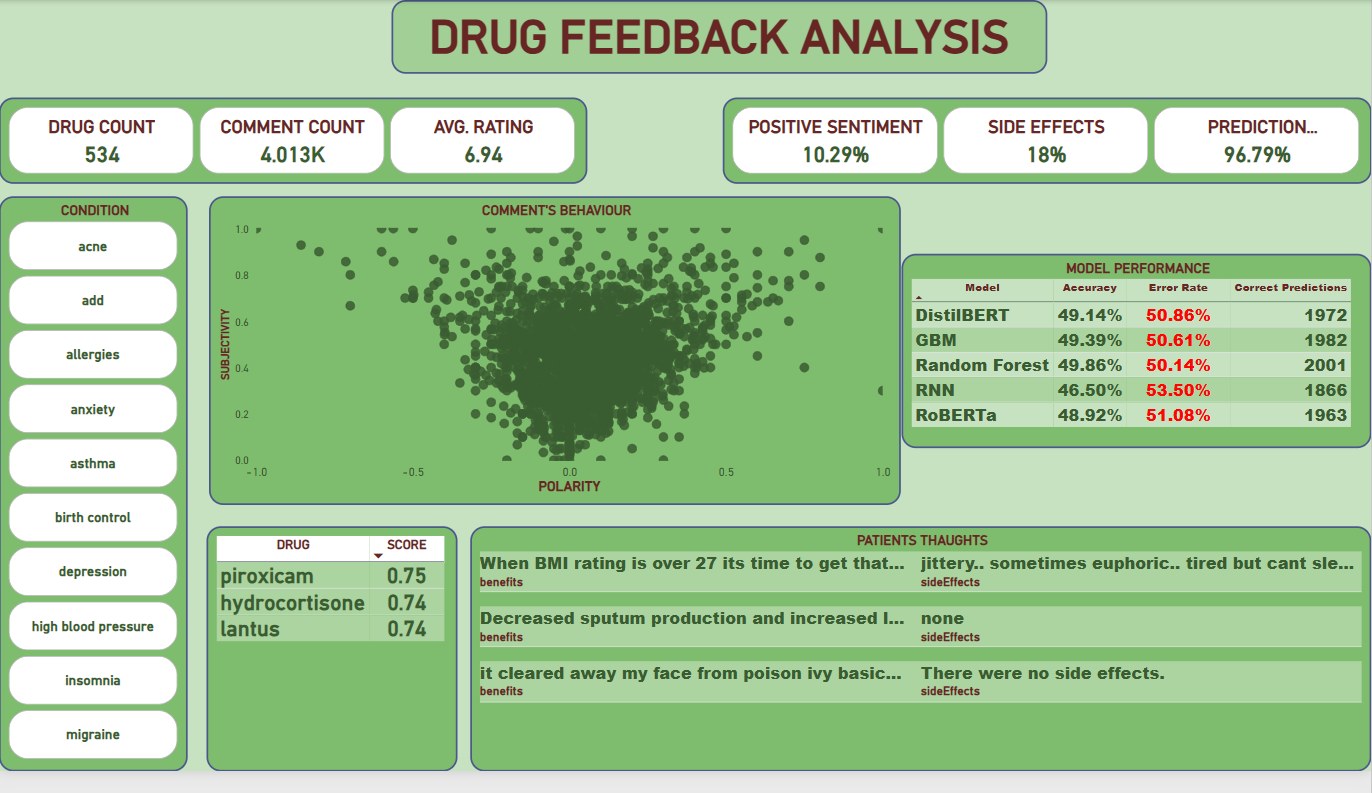
I used Python, NLP and transformer model experimentation on patient review text, then created a Power BI reporting layer for sentiment, rating, side-effect and model-output exploration.
Key numbers
534
drugs
4,013
comments
6.94
avg rating
What I wanted the report to help with
How I approached it
- Make the main performance question easier to scan.
- Separate headline totals from the detail that explains them.
- Show enough context for a non-technical user to trust the next action.
- Cleaned review text and rating fields.
- Tested sentiment and transformer-based approaches.
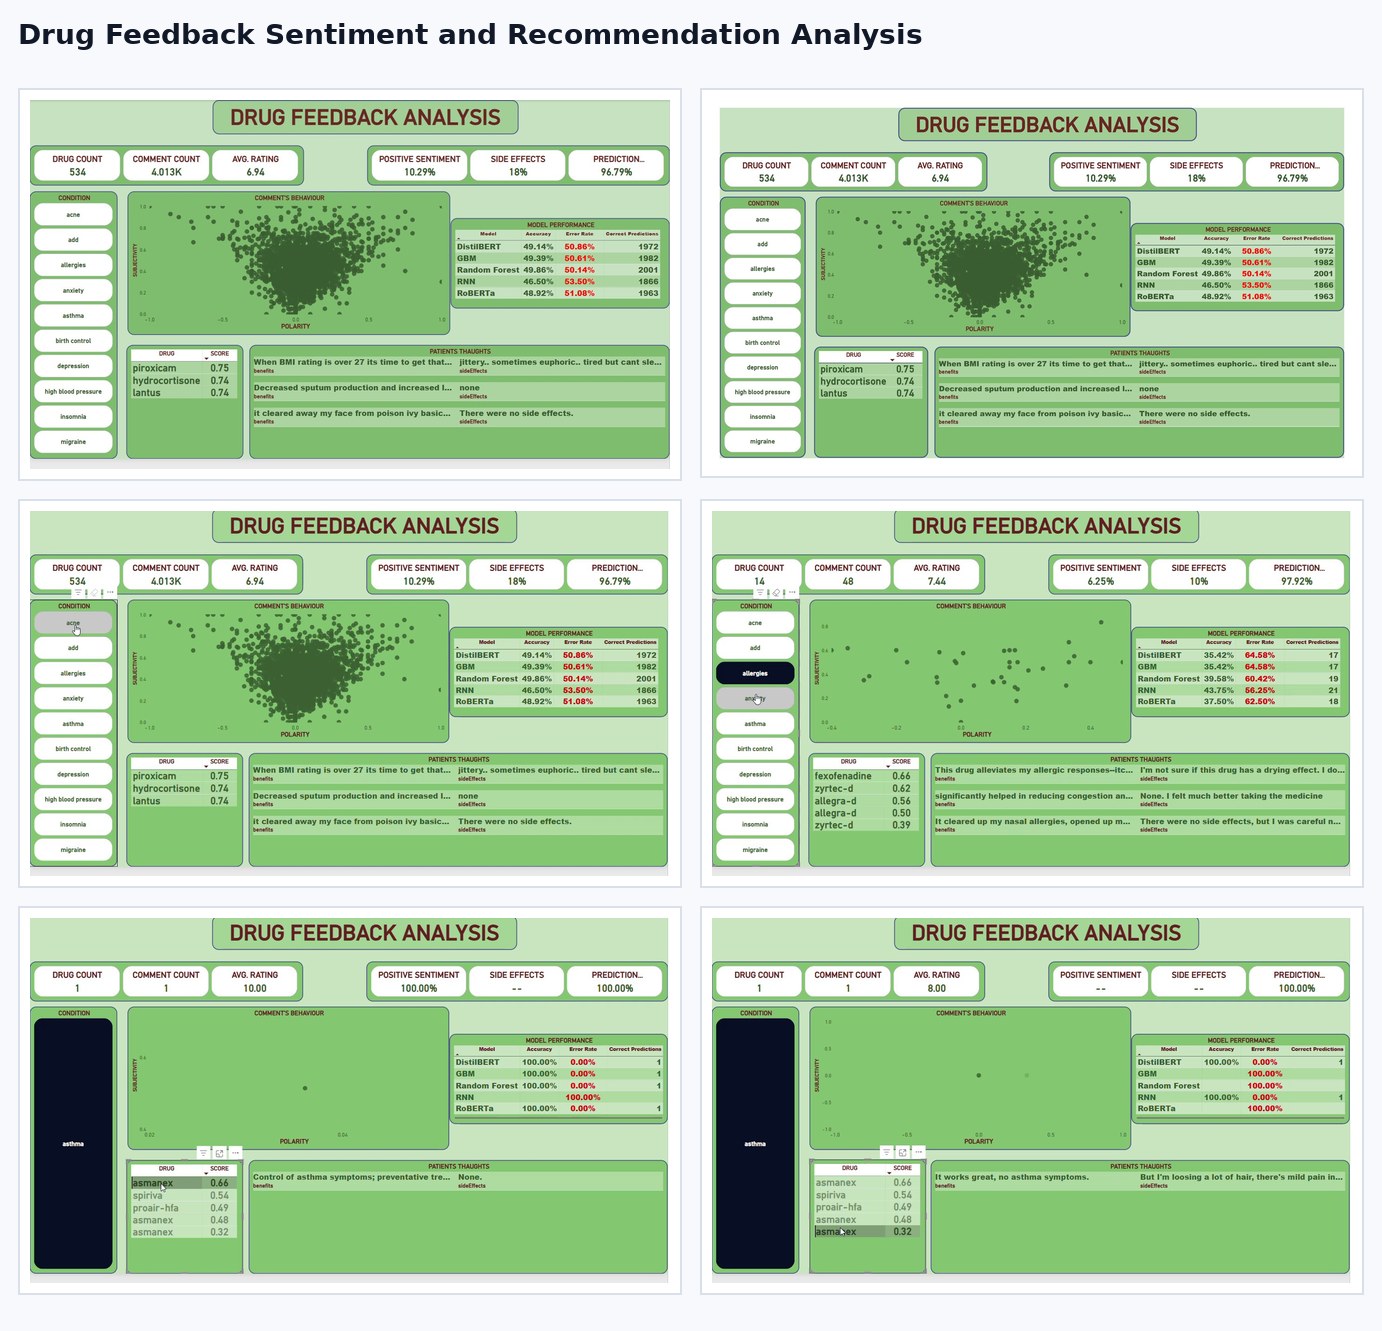
- Built reporting views for sentiment, ratings and side-effect themes.
Technical inspection notes
- Treated patient review text as messy qualitative data, not a clean rating table.
- Used NLP and transformer experimentation to explore sentiment and recommendation-style signals.
- Kept Power BI as the reporting layer, not the modelling layer.
- Made limitations visible because drug feedback is not clinical advice and model output needs careful interpretation.
Dashboard snapshots
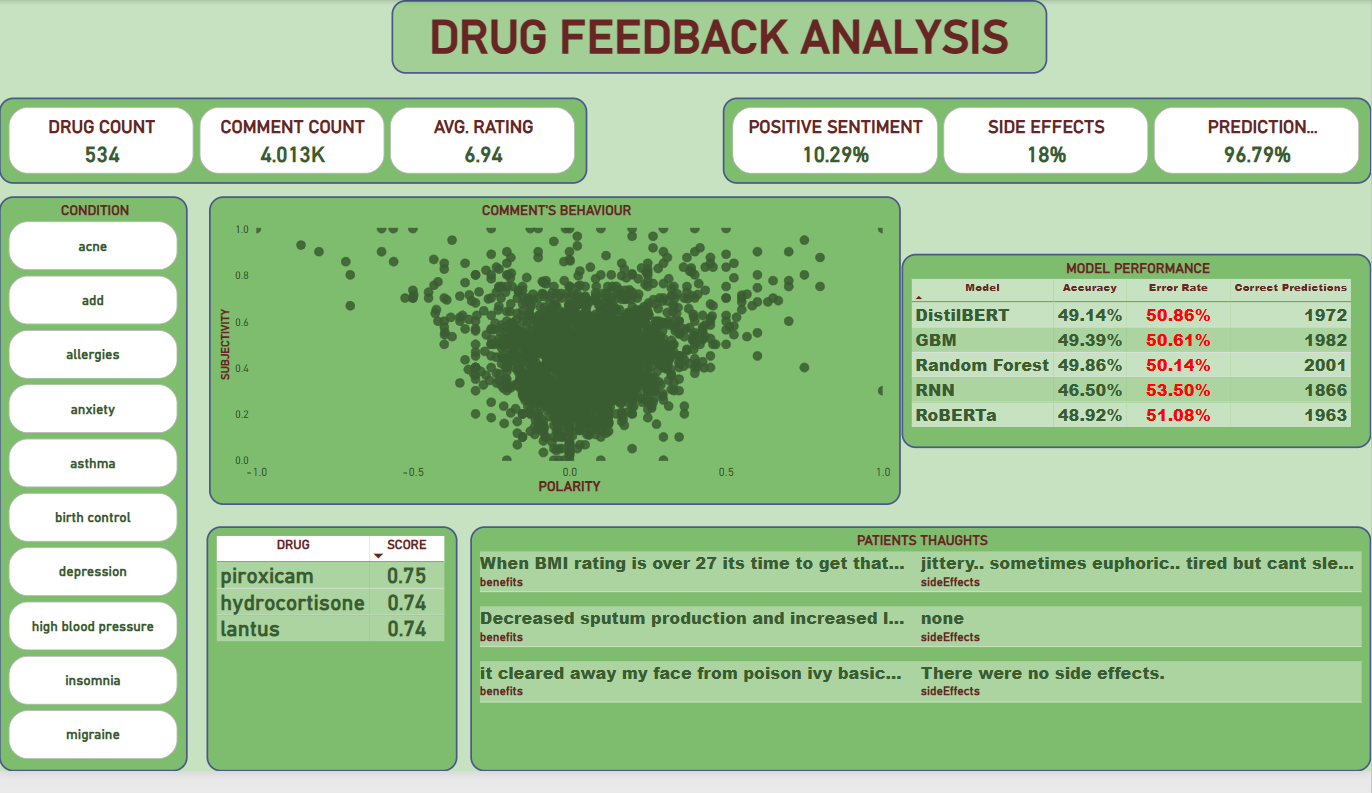
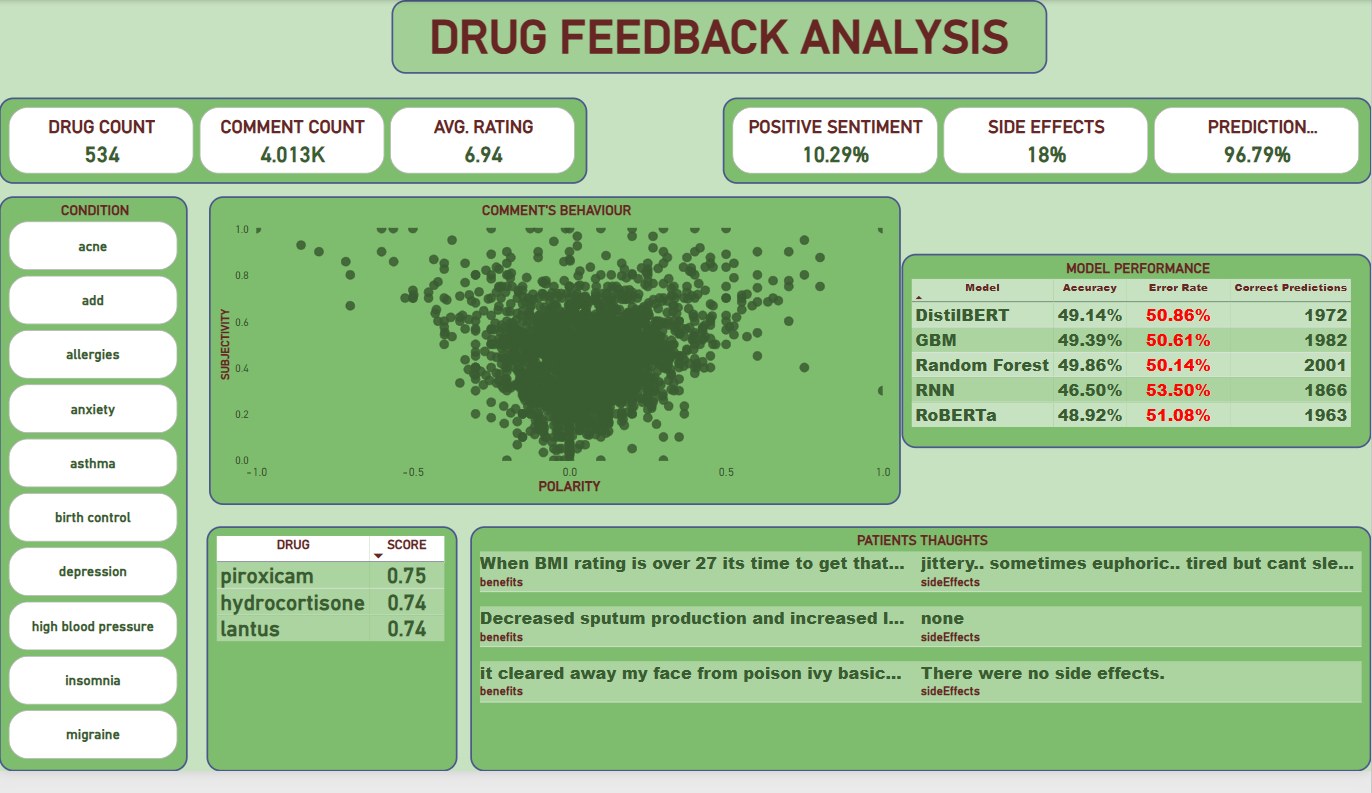
These snapshots show how the analysis was turned into decision-ready visuals.
Click any screenshot to inspect the dashboard evidence more closely.
What the analysis showed
- The dashboard view included 534 drugs.
- It included about 4,013 comments.
- Average rating was 6.94 in the selected view.
What I would improve next
- Add stronger model validation.
- Avoid clinical recommendation claims without expert review.
- Add confidence and bias notes beside model outputs.