Why this matters
Build summary
Customer value is easier to act on when customers are grouped by behaviour, not only by demographics or one-off sales.
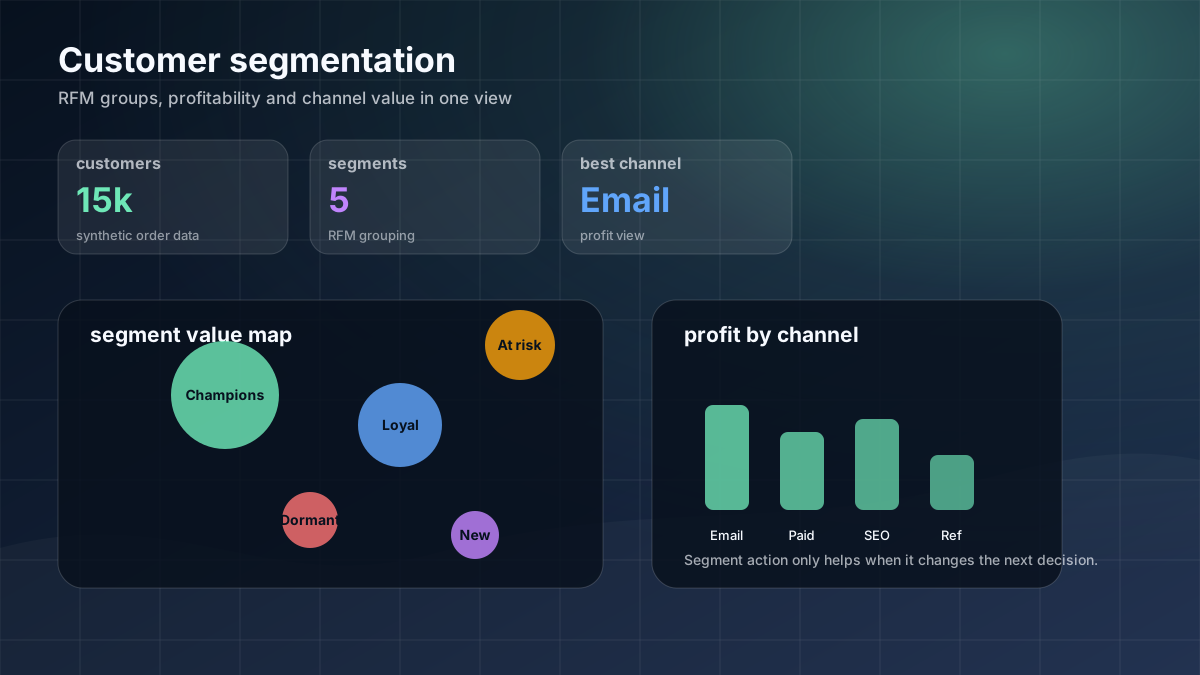
I calculated RFM scores using synthetic order-history data, grouped customers into readable segments and compared revenue, profit, frequency, recency and acquisition channel performance.
Key numbers
15,000
customers
£4.79M
net revenue
RFM
segmentation model
What I wanted the report to help with
How I approached it
- Make the main performance question easier to scan.
- Separate headline totals from the detail that explains them.
- Show enough context for a non-technical user to trust the next action.
- Created recency, frequency and monetary value scores.
- Grouped customers into readable portfolio segments.
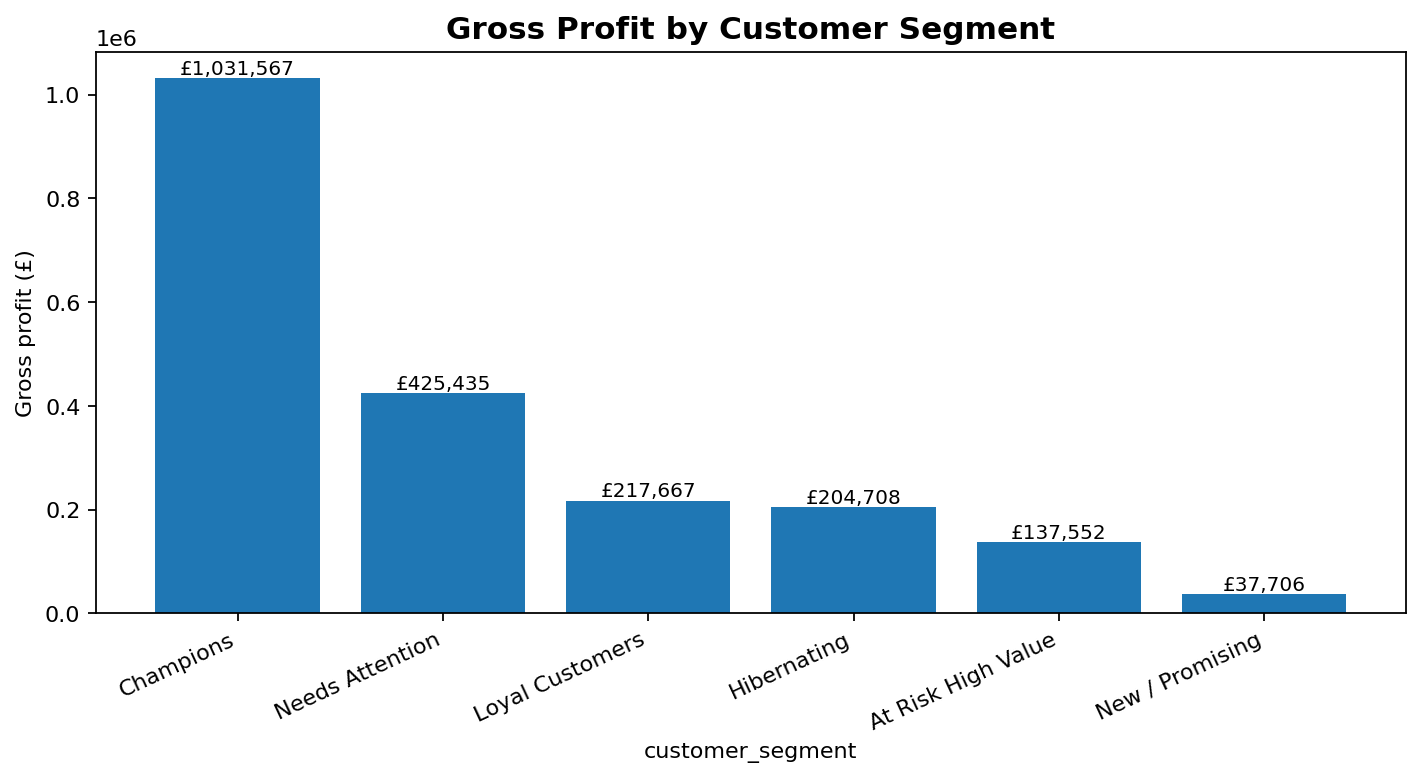
- Compared segment value by revenue, profit and acquisition channel.
Technical inspection notes
- Built RFM-style features from order history: recency, frequency and monetary value.
- Compared segment value using both revenue and profit so high spend did not automatically mean high commercial value.
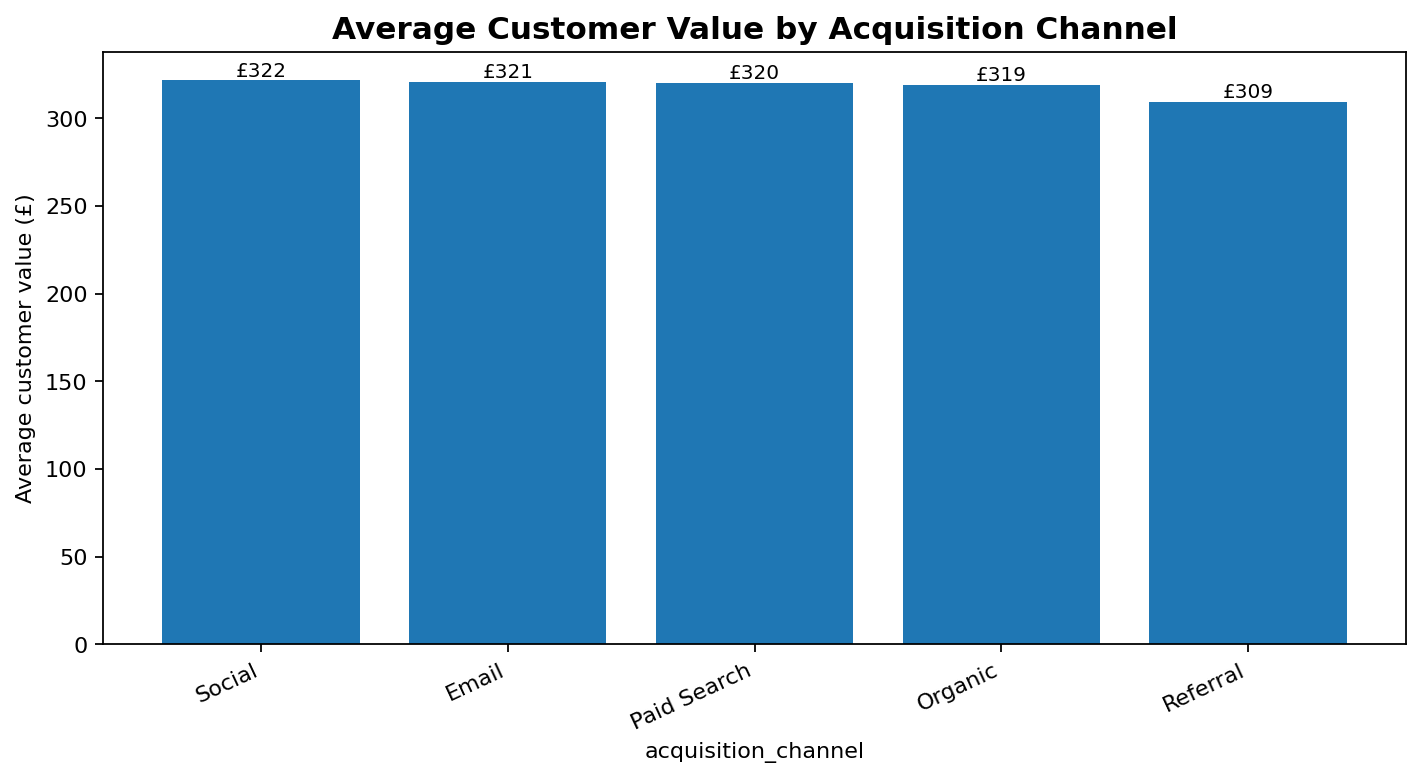
- Added acquisition-channel comparison to show whether some channels attract stronger customer groups.
- Kept segment names readable so the output could support marketing actions rather than just analysis notes.
Dashboard snapshots
These snapshots show how the analysis was turned into decision-ready visuals.
Click any screenshot to inspect the dashboard evidence more closely.
What the analysis showed
- The model segmented 15,000 customers.
- The sample produced £4.79M net revenue.
- Segment value varied meaningfully by acquisition channel.
What I would improve next
- Add retention-window logic.
- Test segment movement over time.
- Connect campaign response data to each segment.