Why this matters
Build summary
Safeguarding reporting needs clarity, but this is sensitive work. I used mock data to demonstrate the reporting approach safely.
I used mock data only, cleaned referral categories in Power Query and created DAX measures for referral volume, higher-risk share and need-category analysis.
Key numbers
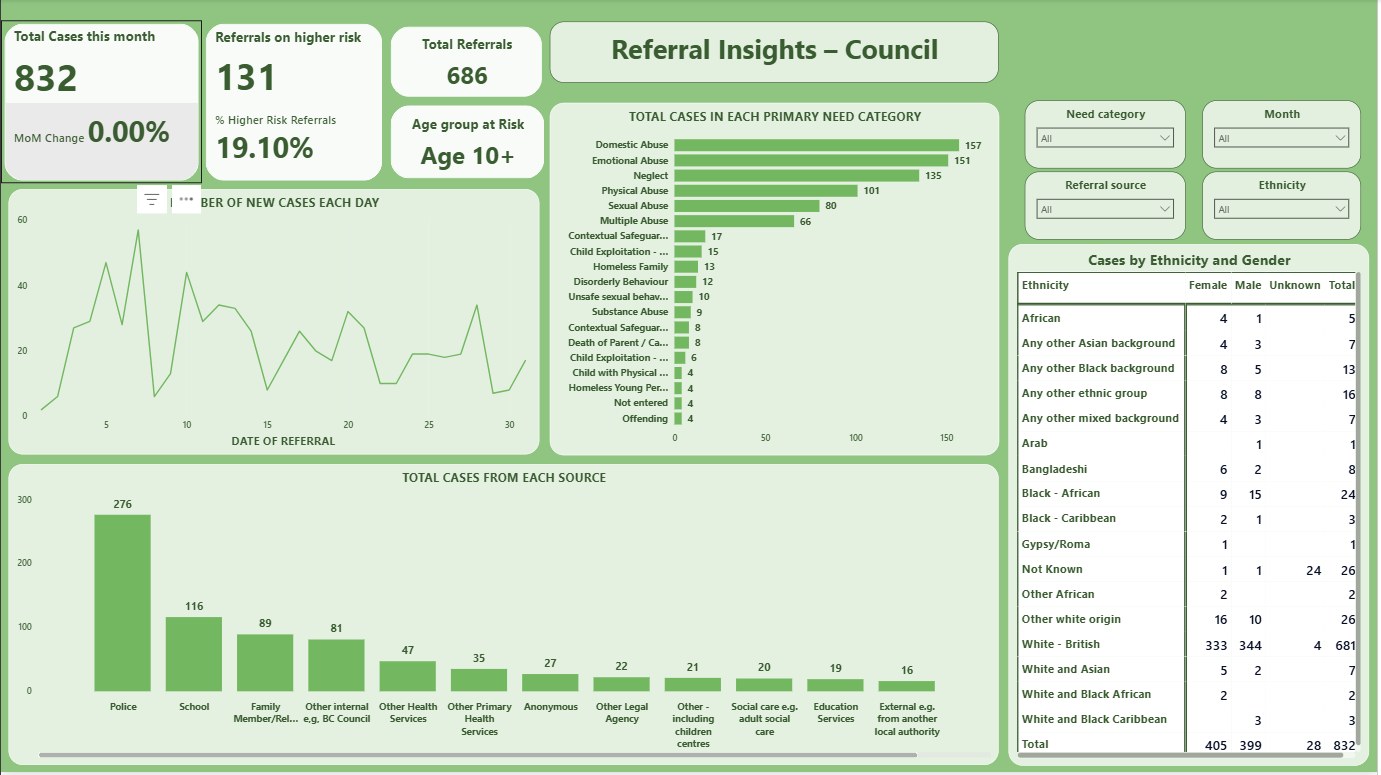
832
cases shown
131
higher-risk referrals
Mock
sensitive domain
What I wanted the report to help with
How I approached it
- Make the main performance question easier to scan.
- Separate headline totals from the detail that explains them.
- Show enough context for a non-technical user to trust the next action.
- Built a mock referral dataset.
- Cleaned need and risk categories.
- Created DAX measures for referral volume, source and higher-risk share.
Technical inspection notes
- Used mock safeguarding data only, because this is a sensitive topic where real records should not be exposed.
- Grouped referral source, need category and risk level to support operational scanning.
- Created higher-risk share measures so teams can compare pressure without relying only on raw volumes.
- Kept the dashboard simple because safeguarding reporting needs clarity more than decoration.
Dashboard snapshots
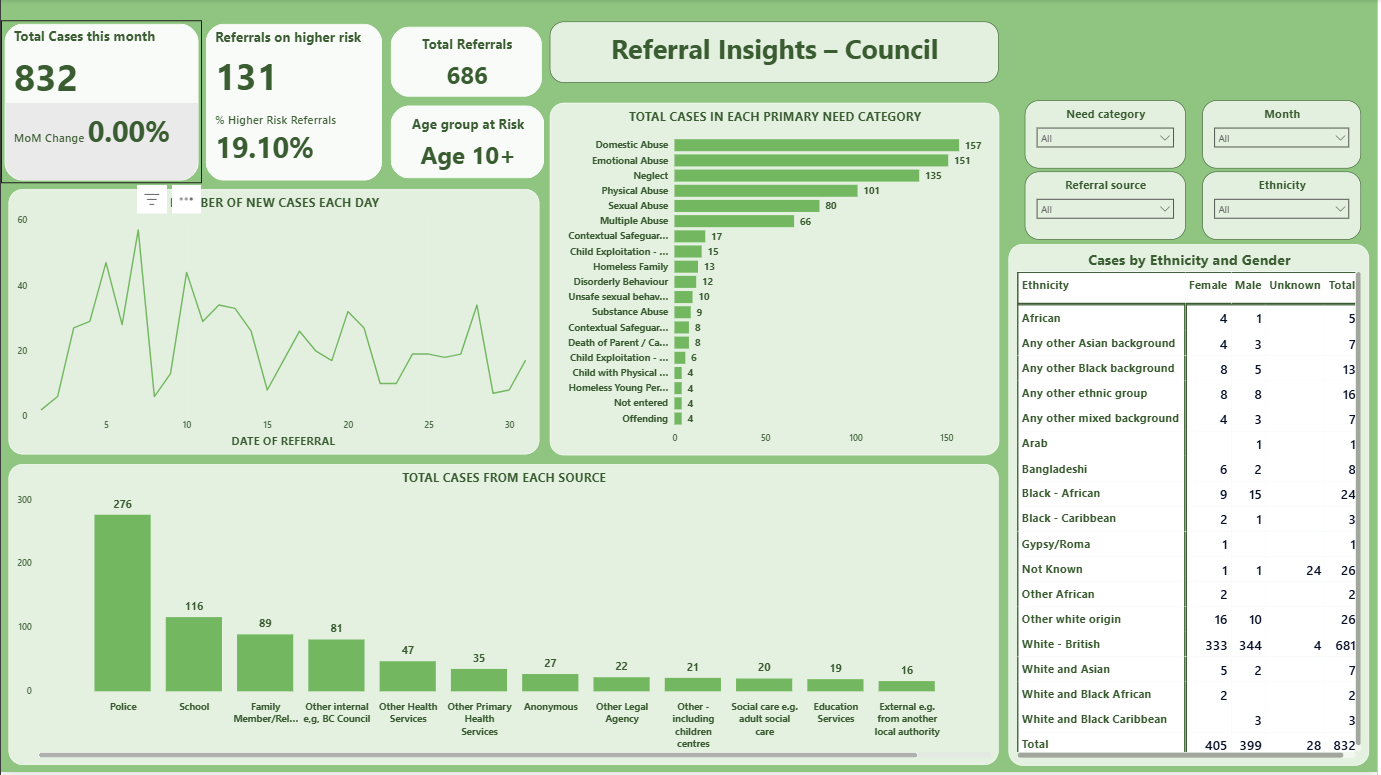
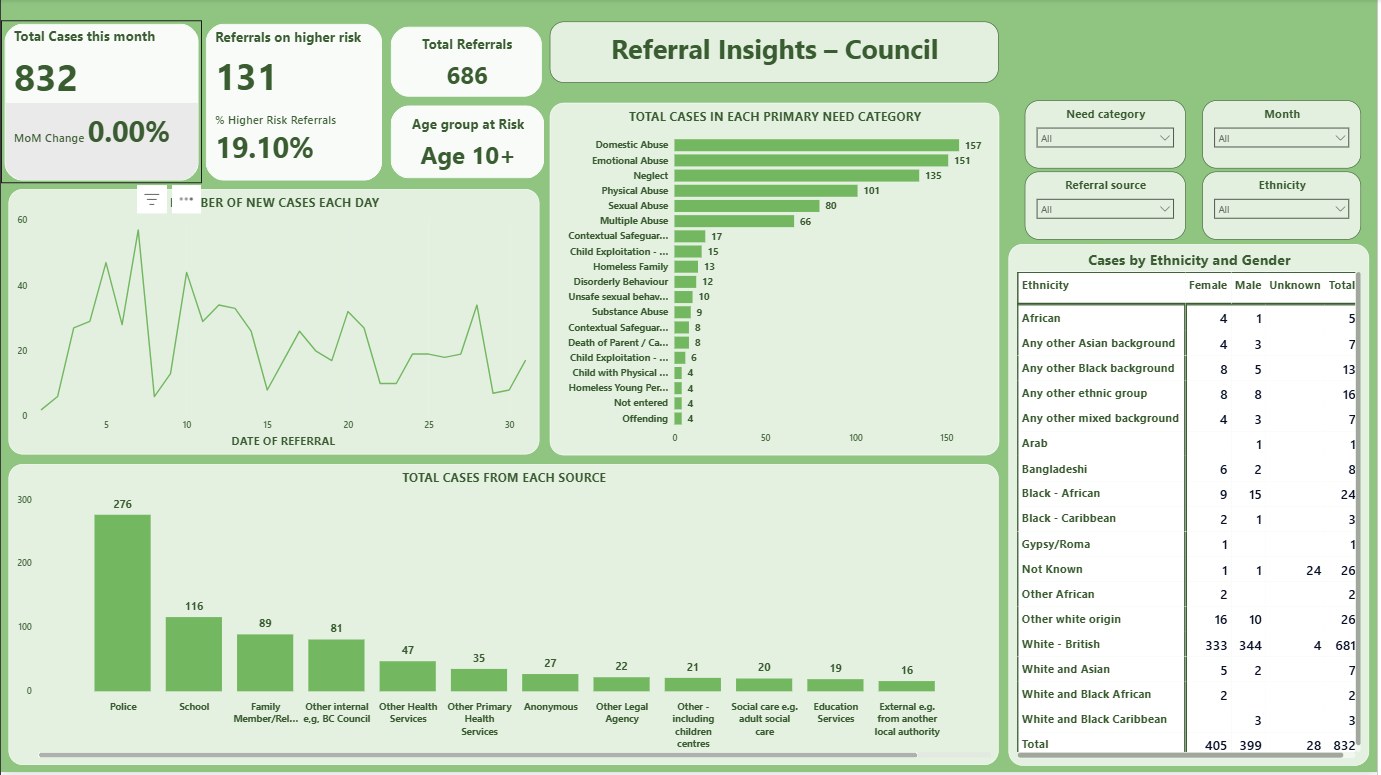
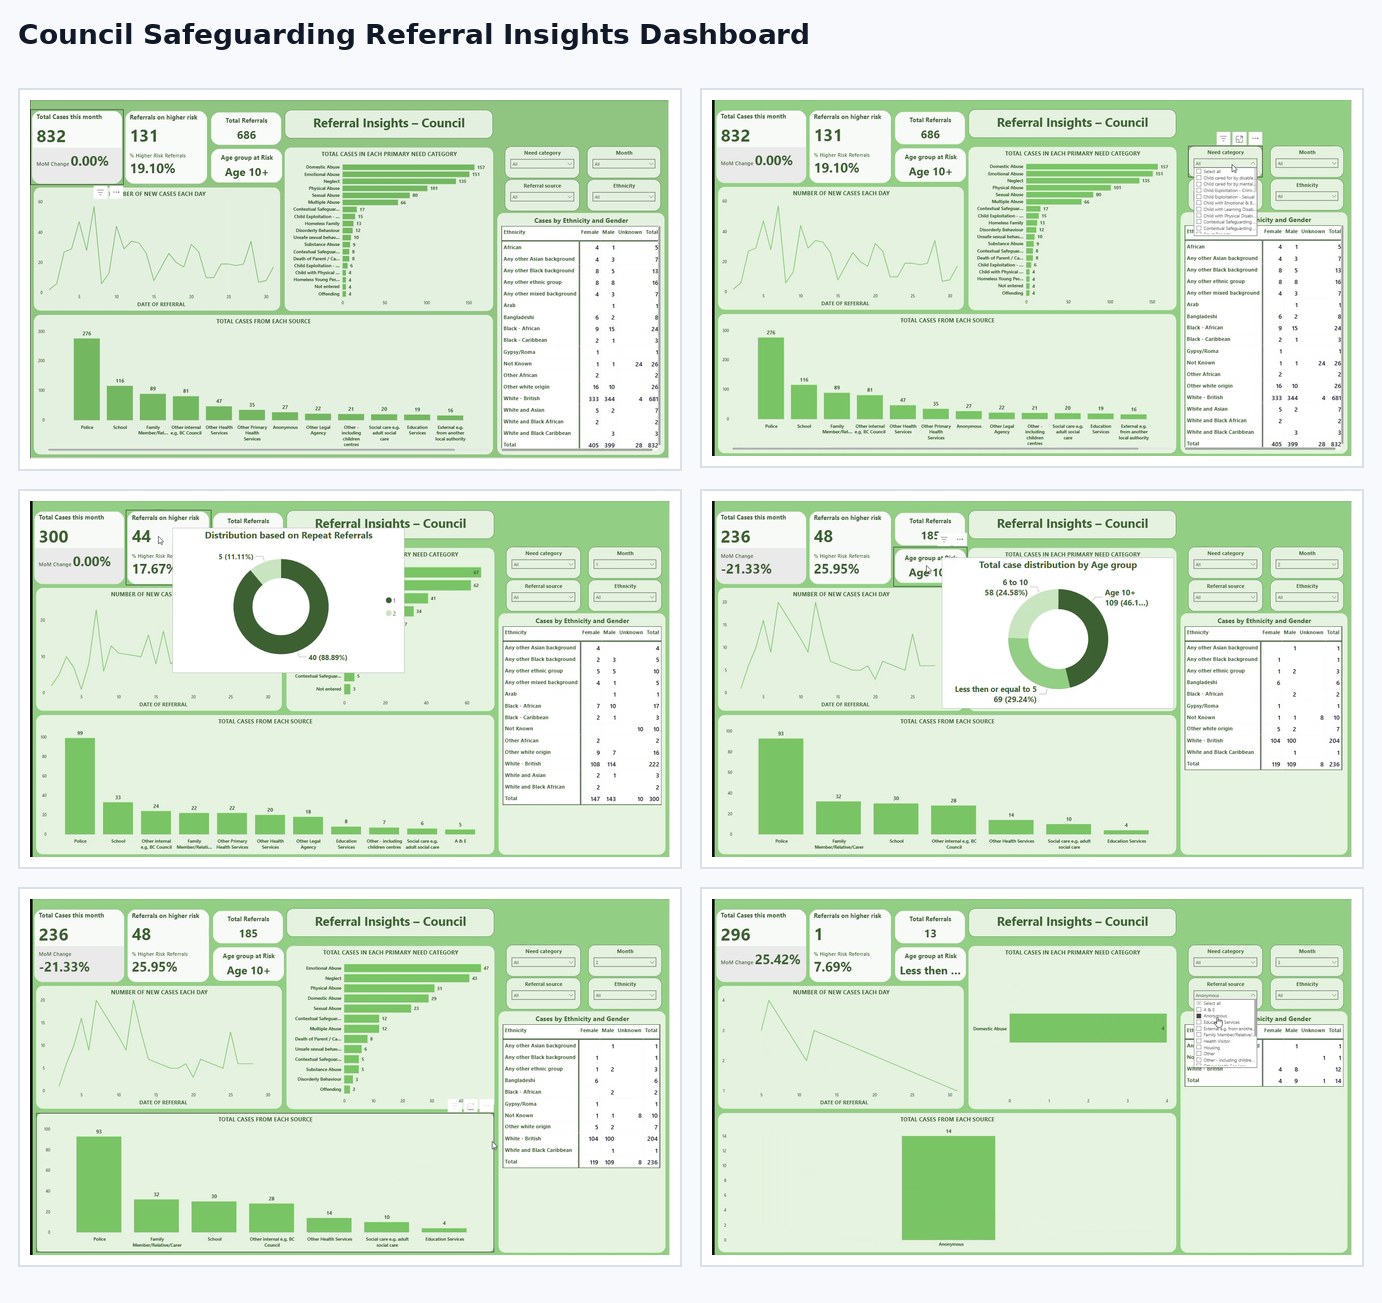
These snapshots show how the analysis was turned into decision-ready visuals.
Click any screenshot to inspect the dashboard evidence more closely.
What the analysis showed
- The selected view showed 832 cases.
- 131 referrals were higher risk.
- Mock data allowed the reporting idea to be shown safely.
What I would improve next
- Add role-based access in a real environment.
- Add referral timeliness measures.
- Add stronger information governance notes.